Bitcoin's Fragile Floor
Options mechanics are quietly building a trapdoor beneath Bitcoin's price.

A Week of Contradictions
Bitcoin entered the week around $68,000, lifted by a late-March relief rally on fading Iran war tensions. Midweek optimism briefly pushed BTC near $69,000 as ceasefire hopes lifted risk assets across the board. Then came the reversal.
President Trump's Wednesday night address, threatening escalated strikes against Iran, sent shockwaves through every market. By Thursday, BTC had slipped to $66,200, erasing the week's gains and closing the holiday-shortened period down roughly 3%.
A 3% decline in Bitcoin is unremarkable on its own. What makes this week significant is the structural fragility it exposed underneath.
The Negative Gamma Trap
The most critical risk facing Bitcoin right now is not geopolitical. It is mechanical.
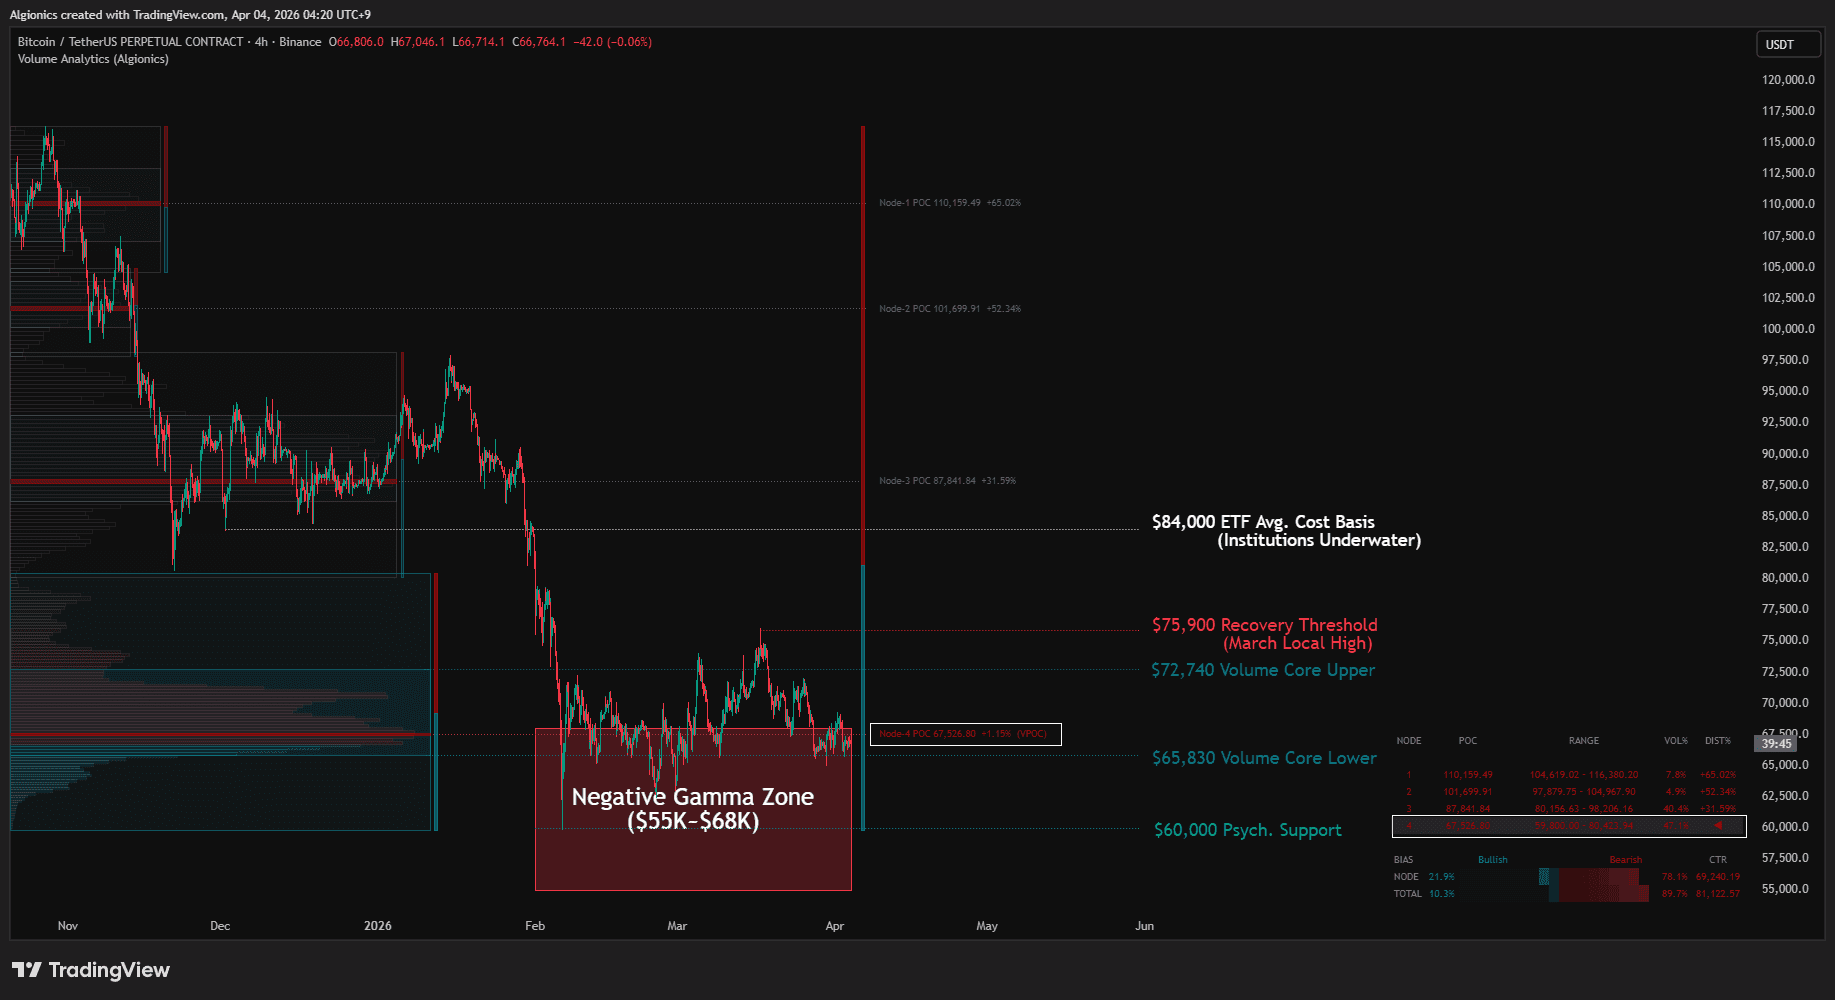
According to Glassnode's weekly report, negative gamma exposure has been building in Deribit-listed options from $68,000 all the way down to the mid-$50,000s. Options dealers who sold put contracts to investors seeking downside protection are now forced to sell Bitcoin as the price falls. Rather than absorbing selling pressure, their hedging amplifies it.
This creates a self-reinforcing feedback loop: a move below $68,000 triggers dealer selling, which pushes the price lower, which triggers more hedging, which drives further declines. What would normally be a gradual pullback can accelerate into a sharp repricing, potentially revisiting the $60,000 level tested during the early-February selloff.
The timing makes it worse. Following the $14.16 billion options expiry on March 27, the largest of 2026 so far, market liquidity has thinned considerably. Easter weekend further drains the order book. There may simply not be enough buyers to absorb a cascade of forced selling if it materializes.
Whales Are Distributing
On-chain data adds another layer of concern.
CryptoQuant's Exchange Whale Ratio, which tracks the share of total exchange inflows coming from the top 10 deposits, surged from 0.34 in January to 0.79 by late March. This means large holders have been consistently moving coins to exchanges throughout 2026, a pattern typically associated with distribution rather than accumulation.
Two notable spikes on March 14 and March 28 suggest that whale selling has been episodic but persistent, and the trend shows no sign of reversing. When the largest participants in the market are positioning to sell, it undermines the structural demand needed to defend key support levels.
ETF Flows: A Mixed Signal
Spot Bitcoin ETFs delivered a rare bright spot in March, recording $1.32 billion in net inflows after four consecutive months of redemptions. The reversal broke a streak that had drained nearly $1.82 billion in January and February combined.
However, the recovery was front-loaded. Inflows faded toward month-end, and the final week of March flipped back to net outflows. Q1 2026 still closed with roughly $500 million in net redemptions overall.
More importantly, the average cost basis for Bitcoin ETF holders sits near $84,000, well above the current spot price. Most institutional holders remain underwater, which creates latent selling pressure if sentiment deteriorates further.
Fear at Extremes
The Crypto Fear & Greed Index dropped to 8 on April 1 and 12 on April 2, the lowest readings in over two years. Historically, extreme fear has preceded 7-to-14-day relief rallies. But it has also preceded extended drawdowns when macro conditions remained hostile.
Bitcoin dominance held steady at 56-58%, suggesting capital is rotating toward perceived safety within crypto rather than exiting entirely. This stability during extreme fear has, in past cycles, preceded either a durable bottom or one final leg down.
The Levels That Matter
The $67,000 level has acted as a strong support base throughout 2026, with every dip below it being quickly reclaimed. A sustained 3-day close below this level, combined with weakening ETF and whale data, could trigger the next leg down.
Below $67,000, the next support sits at $61,500, the 0.382 Fibonacci retracement level, followed by $60,000 as a psychological and technical floor. A break under that range opens the door to $57,000 and eventually $52,600, which aligns with the 0.618 Fibonacci retracement.
On the upside, BTC would need to reclaim and hold above $75,900, the March local high, to weaken the current bearish structure and shift the outlook from defensive to constructive.
What to Watch Next Week
Three catalysts will shape Bitcoin's near-term direction.
First, the FOMC Minutes release on April 8 will reveal how the Fed is processing surging energy costs and their pass-through into inflation expectations. Any hawkish shift in tone would further complicate the case for risk assets.
Second, the March CPI report on April 10 is the week's main event. If energy-driven inflation surprises to the upside, rate cut expectations could be pushed further out, removing a key pillar of the recovery thesis.
Third, the Iran situation remains the overriding variable. Oil at $110 per barrel is already straining markets. A push toward $120 would reopen the path to BTC's low $60,000s. Credible de-escalation and oil pulling back toward $100 could trigger a short squeeze toward $70,000 to $74,000.
For now, April is about survival above $60,000.
Disclaimer: This content is for informational purposes only and does not constitute financial advice. Always conduct your own research before making investment decisions.
Free on TradingView
What are you still configuring?
While others sell you "highly customizable" and leave you with endless settings to figure out, we eliminated all of them and called it "engineering".
ARES Generation 1
Coming April 22.
Latest


Ready to begin?
A precise tool for those who've already decided how they trade.
