Trend Momentum
A practical guide to reading directional pressure, force boundaries, and market state on your chart.
Reading the Indecator
01
Force Boundary
The histogram plots Bull Force above the zero line and Bear Force below it.
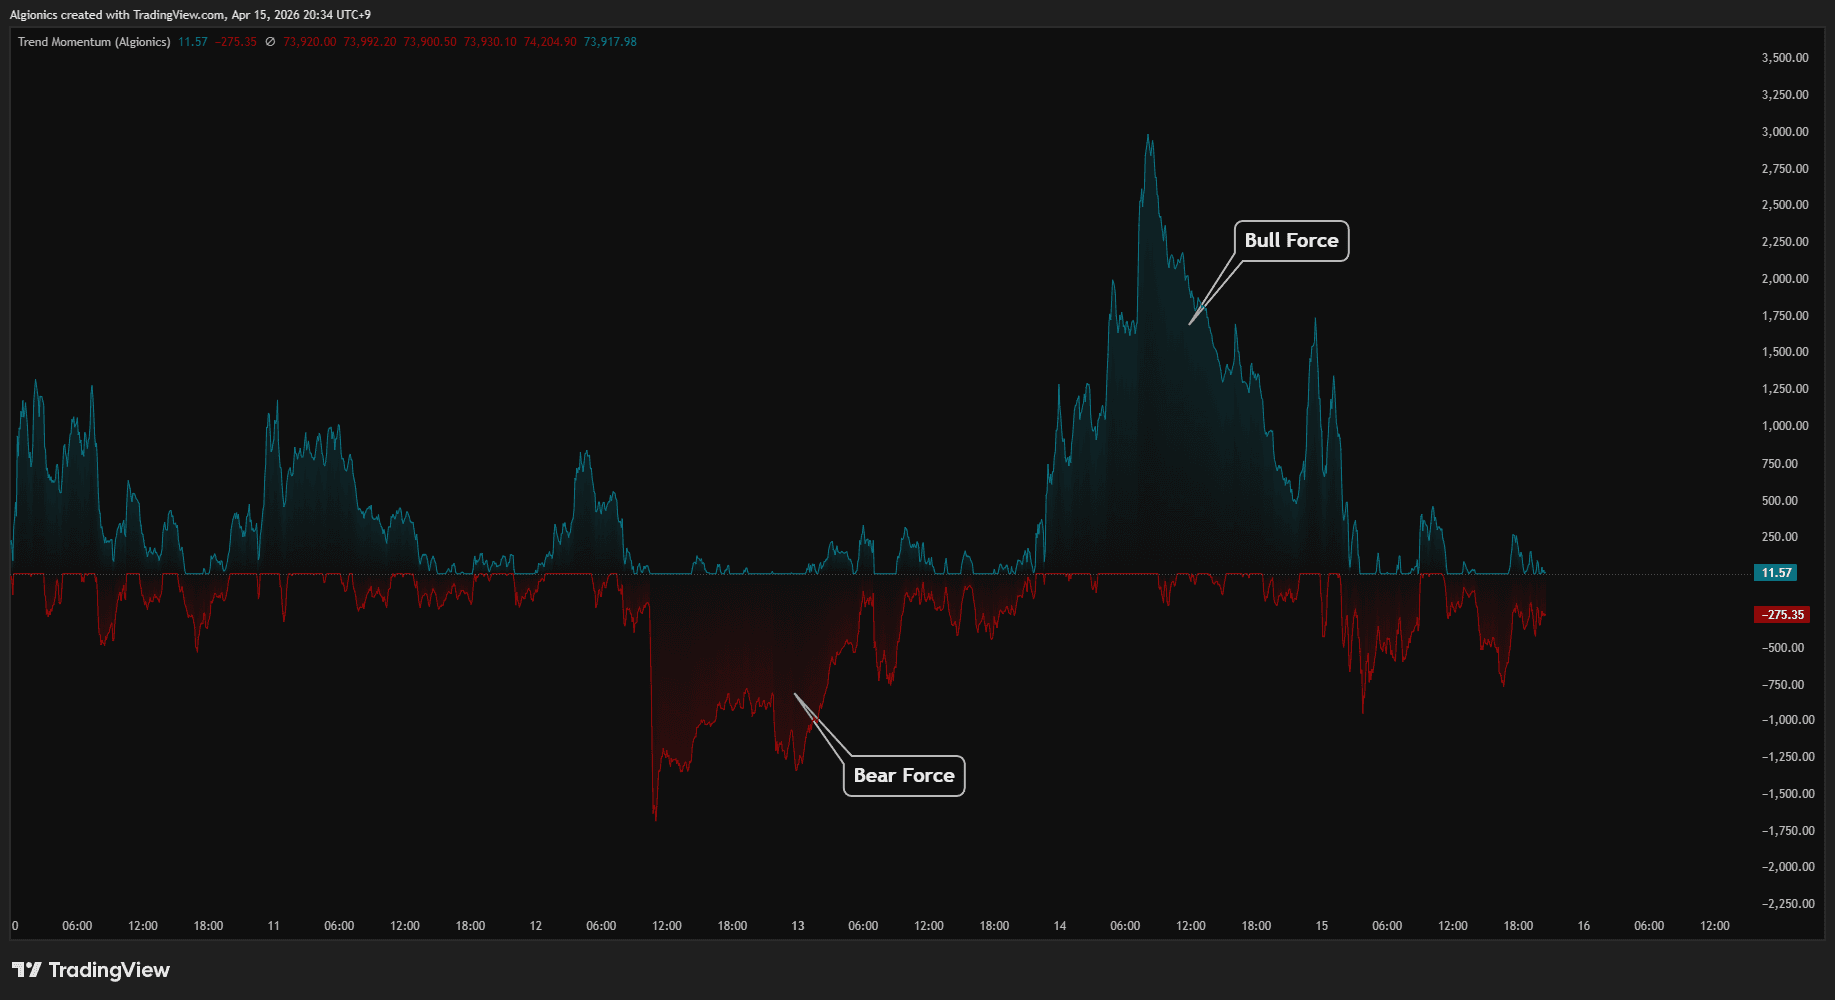
Bull Force measures the distance from price to the bottom edge of the field. Bear Force measures the distance from price to the top edge. Together they define the total force range.
When price is inside the field, both forces are active. When price breaks above, only Bull Force extends. When price drops below, only Bear Force extends.
The range expands as price moves away from the field edges and compresses as it returns toward the center.
Bias Line
The Bias Line sits inside the force boundary. Its position is determined by the pressure ratio across the field.
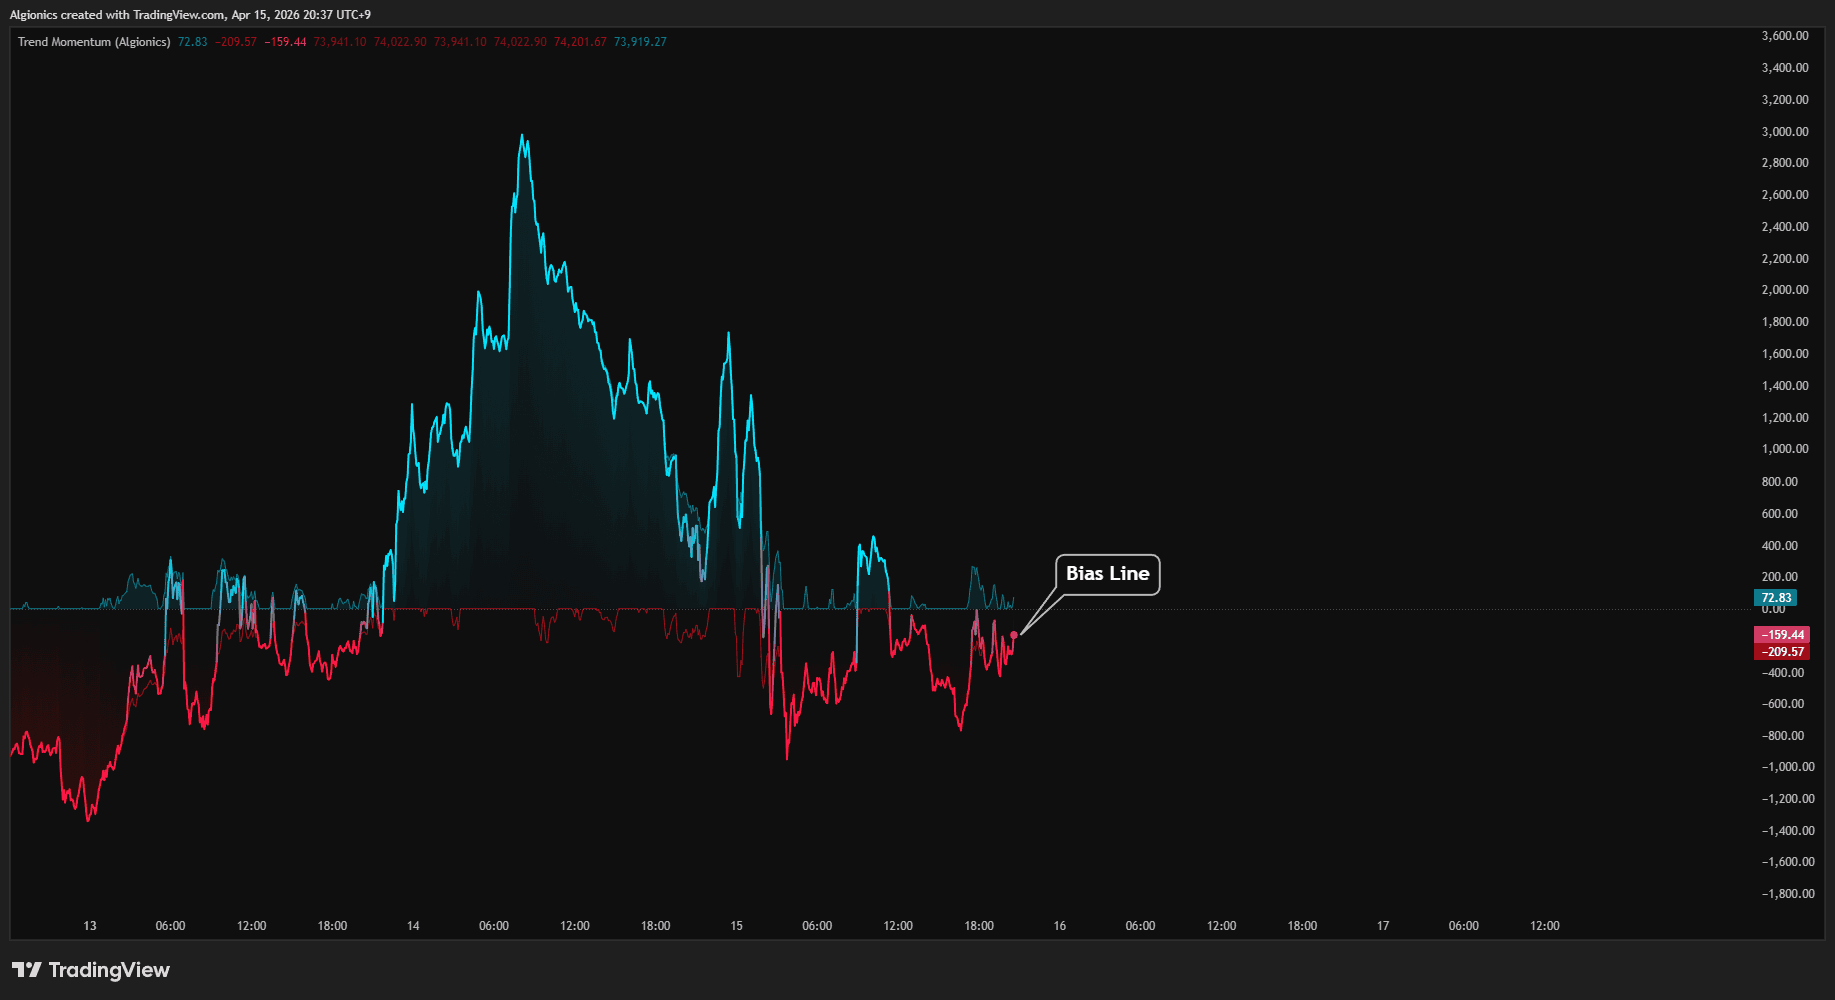
When the majority of lines in the field are below price, the ratio tilts bullish and the Bias Line shifts toward Bull Force. When most lines are above price, the ratio tilts bearish and the line shifts toward Bear Force.
The color follows the same logic. It transitions from bear color near the bottom of the range to bull color near the top.
The Bias Line does not measure trend direction. It measures where the current balance of pressure places price within the available force range.
Ribbon Overlay
The ribbon draws two boundary lines on the price chart. The upper line marks the highest value across the field. The lower line marks the lowest.
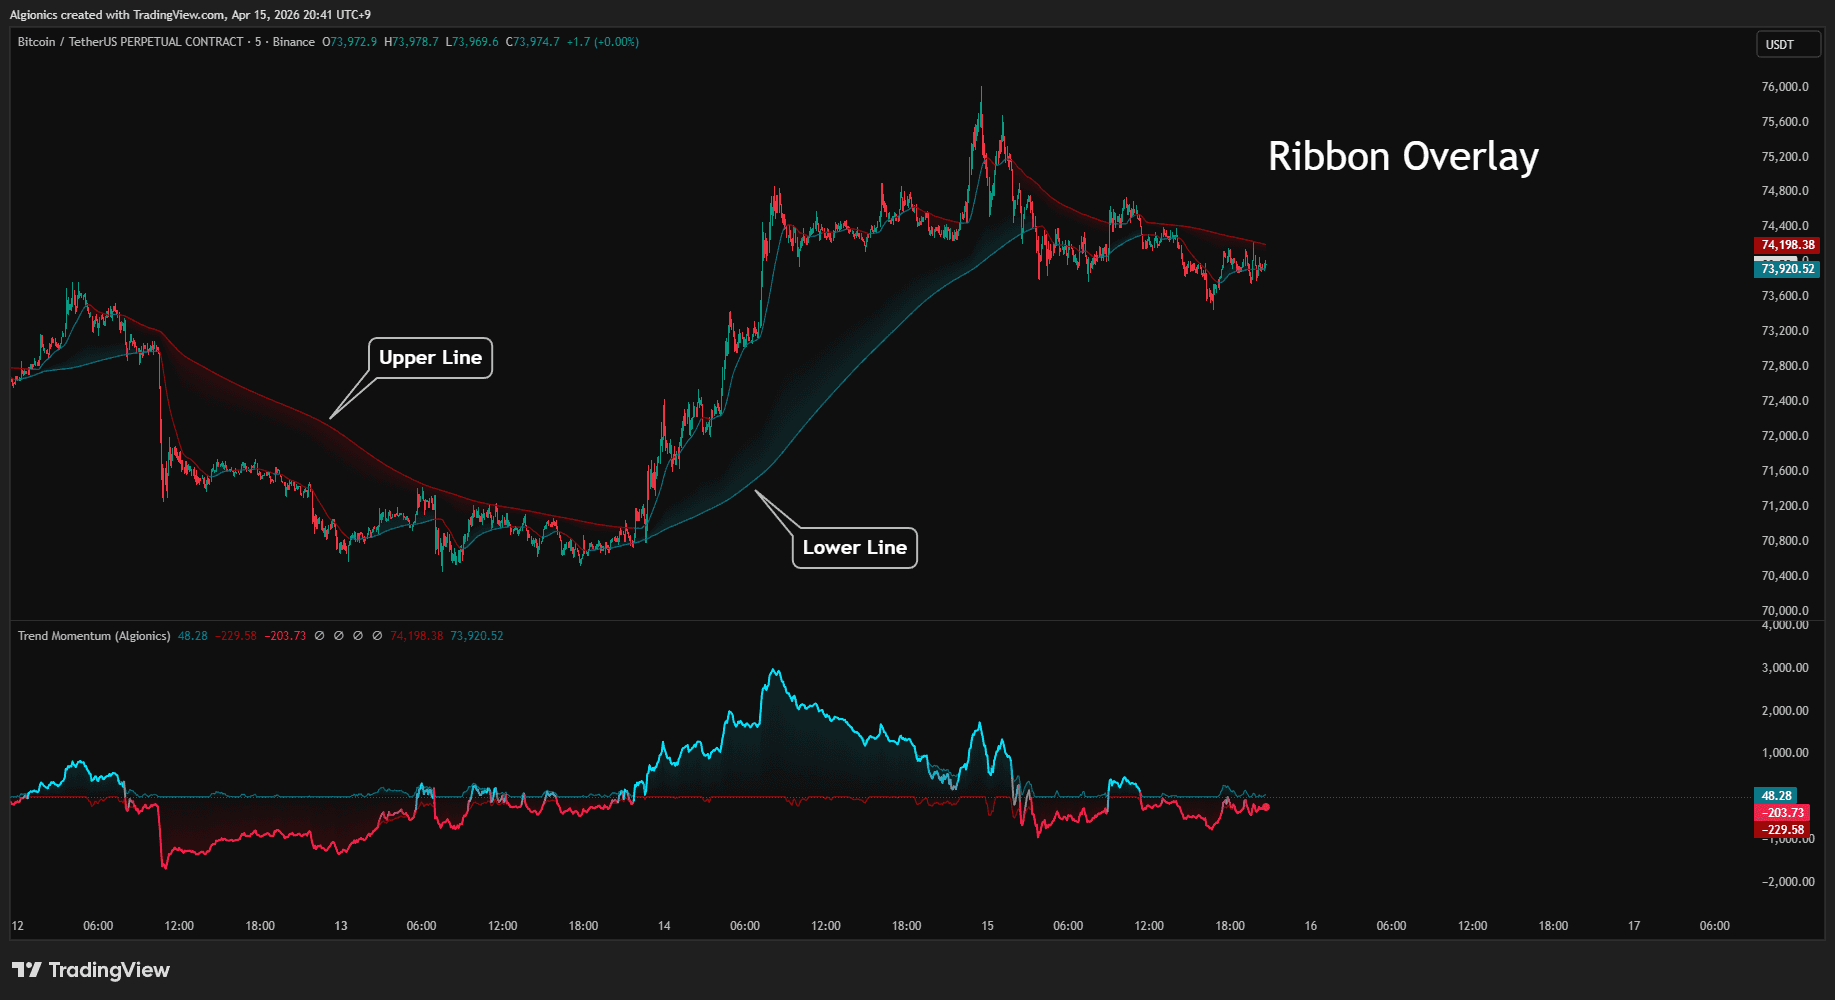
Each boundary changes color based on price crossovers. When price crosses above a boundary, it turns bull color. When price crosses below, it turns bear color. The two boundaries update independently.
A gradient fill appears between price and the nearest boundary. The fill fades as price moves away from the edge, giving a visual sense of how deep price sits within the field.
Price Candles
When enabled, candles on the main chart are colored based on where the Bias Line sits within the force boundary.
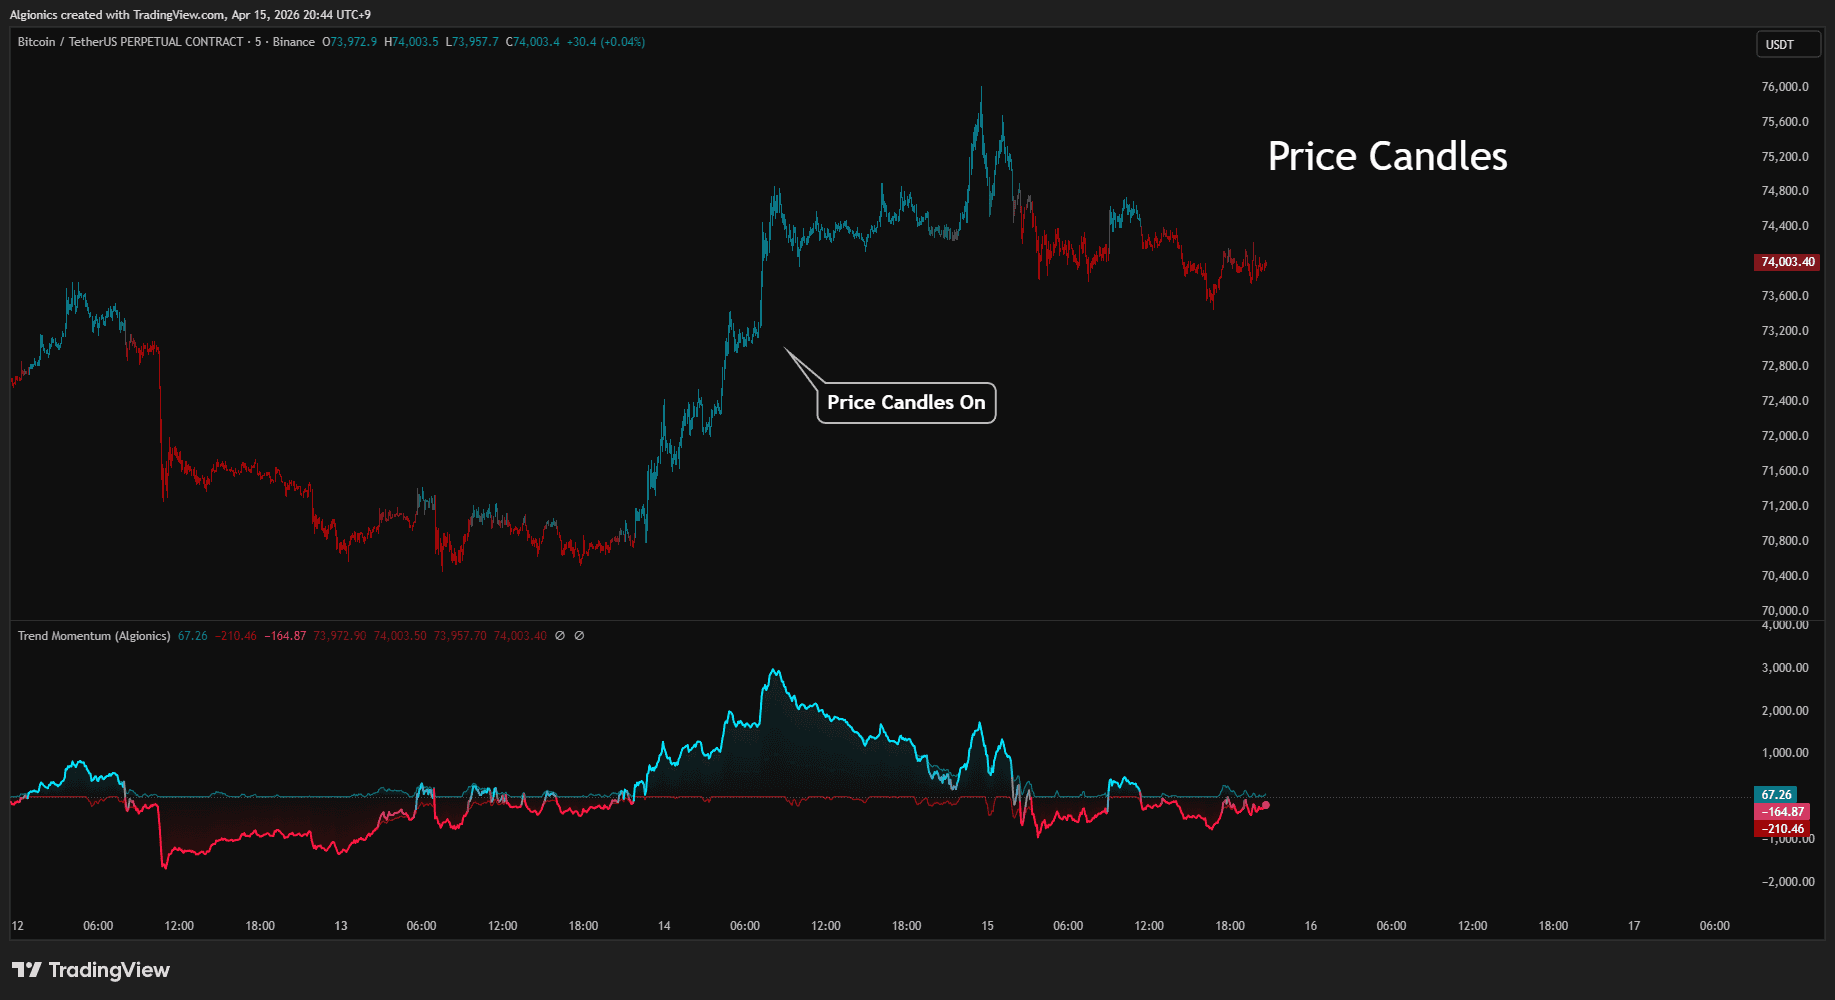
The indicator converts the Bias Line position into a scale from -1 to +1. At the bottom of the range the candle takes bear color. At the top it takes bull color. Values in between produce a blended gradient.
This coloring reflects the current pressure balance, not price direction. A green candle with bear-colored fill means price rose but the field pressure remains tilted to the downside.
Dashboard
02
BIAS
The BIAS row displays the bull and bear pressure percentages. Bull percentage shows how much of the total pressure favors the upside. Bear percentage shows the remainder.
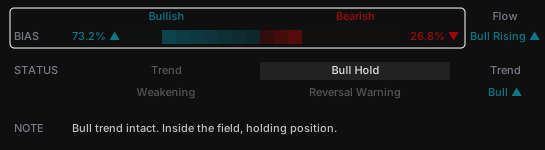
Each value updates with a directional arrow. An upward arrow means the percentage increased from the previous bar. A downward arrow means it decreased.
Flow
The Flow column tracks whether the dominant pressure is accelerating or decelerating. It compares the current pressure percentage against its own smoothed average.
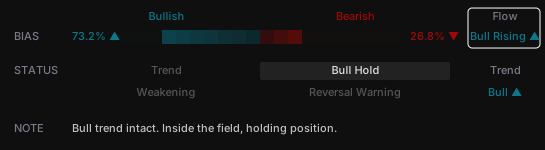
When the percentage is above its average, the label reads Rising. When below, it reads Falling. When the pressure reaches full saturation at either extreme, it reads Maxed.
The label is prefixed with Bull or Bear to indicate which side currently dominates.
Status
The Status section classifies the current market condition into one of four states.
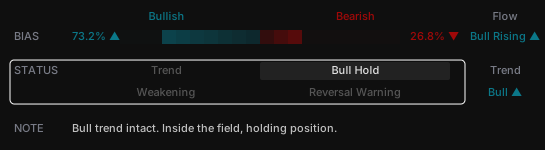
Trend activates when price moves outside the field entirely. The dominant side has full control with no opposing pressure from the field.
Hold activates when the dominant side remains intact but price is inside the field. The trend is maintained without acceleration.
Weakening activates when the dominant side still leads but its pressure is declining. Momentum is fading while the bias has not yet flipped.
Reversal Warning activates when price crosses the center of mass to the opposing side. A potential trend shift is forming.
The active state is highlighted. All others remain dimmed. The Trend column on the right confirms the current directional bias as Bull or Bear.
Trend
The Trend column confirms the established directional bias. It reads Bull when the last confirmed extreme was at full bullish saturation, and Bear when it was at full bearish saturation.
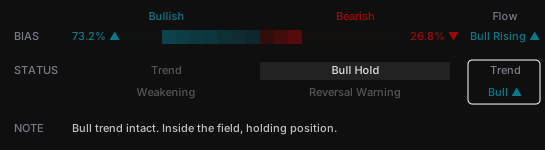
This value only changes when the pressure percentage reaches 100% on either side. Until that happens, the previous direction holds.
Note
The Note row provides a one-line contextual summary tied to the active status.
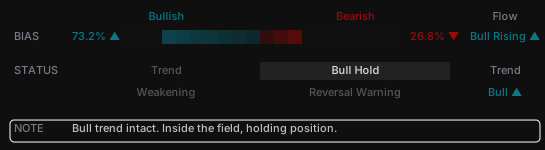
Each of the four states has its own message describing the current condition and what to watch for.
Technical Identity
03
Pressure Ratio
The indicator measures price against every line in the field individually. For each line below price, the distance counts as bull pressure. For each line above, the distance counts as bear pressure. Both sides are summed independently.
The ratio between the two sums produces a single percentage from 0 to 100. This is not a binary above-or-below count. Lines further from price contribute more than lines close to it, so the reading reflects both the number of lines favoring each side and how far they are from price.
At 100, every line sits below price. At 0, every line sits above. At 50, the total upward and downward distances are equal. This percentage is the primary input that drives the Bias Line, the segment bar, and the state engine.
Force Boundary
Bull Force and Bear Force are not derived from the pressure ratio. They measure raw displacement between price and the field edges.
Bull Force is the distance from price to the lowest line in the field. Bear Force is the distance from price to the highest line. When price is inside the field, both values are nonzero. When price exits the field, one side drops to zero.
The space between Bull Force and Bear Force defines the force boundary. The Bias Line is then placed inside this space using the pressure ratio as its positioning weight. A 73% bull reading does not place the line at 73% of the field. It places the line at 73% of the distance between Bear Force and Bull Force at that moment.
This separation between the boundary and the positioning logic means the Bias Line responds to two independent inputs: how far the field edges are from price, and how the internal pressure is distributed.
State Classification
The state engine uses two mechanisms. A trend latch and a condition matrix.
The trend latch sets when the pressure ratio touches either extreme. When it reaches 100, the trend locks to Bull. When it reaches 0, it locks to Bear. The latch does not reset at any intermediate value. It only changes at the next full saturation on the opposite side.
Once the latch is set, the condition matrix classifies the current state using two inputs: where the pressure ratio sits relative to 50, and whether it is rising or falling.
If price is outside the field, the state is Trend. If the pressure ratio is on the dominant side of 50 and holding or rising, the state is Hold. If it is on the dominant side but declining, the state is Weakening. If it has crossed to the opposite side of 50, the state is Reversal Warning.
No threshold in this system is arbitrary. 100 and 0 are mathematical boundaries. 50 is the equilibrium point where upward and downward pressure are equal.
Derived Constants
Every numerical parameter in the indicator traces back to the field structure.
The smoothing length used for flow diagnostics is the geometric mean of the field's minimum and maximum periods. No period is selected by hand.
The field itself is constructed from a fixed arithmetic progression with a single step size. The starting point, ending point, and step are the only constants in the system. Everything else, including the force boundary, the pressure ratio, the state engine thresholds, and the flow smoothing, emerges from those three values.
Settings
04
Display
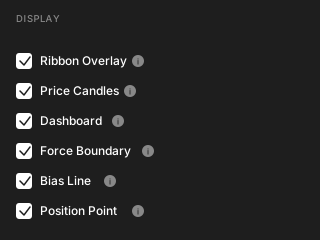
Ribbon Overlay displays the upper and lower field boundaries on the price chart with color-coded crossover states.
Price Candles colors candles on the main chart based on where the Bias Line sits within the force boundary.
Dashboard shows the status panel with BIAS percentages, segment bar, Flow, Status classification, Trend direction, and Note.
Force Boundary plots the Bull Force and Bear Force histogram in the indicator pane.
Bias Line plots the pressure-weighted position line inside the force boundary.
Position Point marks the current Bias Line value on the last bar.
Color Settings
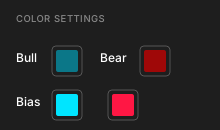
Bull sets the color used for Bull Force, the upper ribbon boundary when price is above it, bullish segments in the dashboard, and the bull end of candle coloring.
Bear sets the color used for Bear Force, the lower ribbon boundary when price is below it, bearish segments in the dashboard, and the bear end of candle coloring.
Bias uses two colors that form a gradient along the Bias Line. The first color applies near the top of the force boundary. The second applies near the bottom.
Tips
05
Reading Force Boundary Width
When the force boundary widens, price is moving away from the field edges. The trend is extending. When it narrows, price is returning toward the field center. The trend is compressing.
A sudden expansion after a narrow phase often marks the start of a directional move. A sustained narrow boundary suggests consolidation.
Status Transition Sequence
The four states follow a natural progression. Trend leads to Hold as price re-enters the field. Hold leads to Weakening as momentum fades. Weakening leads to Reversal Warning as pressure crosses the midpoint.
When a state skips steps, for example jumping from Trend directly to Reversal Warning, it signals a sharp shift in pressure. The faster the sequence moves, the less time available to react.
Combining Flow and Status
Flow and Status measure different things. Status classifies the current condition. Flow tracks whether the pressure behind that condition is accelerating or decelerating.
When Status reads Hold but Flow reads Falling, the trend is intact but losing momentum. Weakening may follow. When Status reads Weakening but Flow reads Rising, the decline in dominance is slowing. The trend may stabilize before reaching Reversal Warning.
The two readings together give a more complete picture than either one alone.
Reading Candle Colors
Candle color does not follow price direction. It follows the Bias Line position within the force boundary.
A rising candle with bear coloring means price moved up but the overall field pressure still favors the downside. A falling candle with bull coloring means price dipped but pressure remains tilted upward.
When candle color and price direction disagree, pay attention. The field is telling a different story than the bar itself.
Reading the Ribbon Boundaries
The upper and lower boundary lines change color independently based on price crossovers. This creates four possible combinations.
Both boundaries bull colored means price has crossed above the entire field. Both bear colored means price is below the entire field. When the upper boundary is bear but the lower is bull, price sits inside the field with room in both directions.
Watch for the moment both boundaries switch to the same color. That confirms price has moved fully to one side of the field, which aligns with the Trend status in the dashboard.