Consensus Oscillator
A practical guide to reading the oscillator and its modes on your chart.
Reading the Oscillator
01
Modes
Consensus Oscillator offers three modes that determine how the oscillator is anchored.
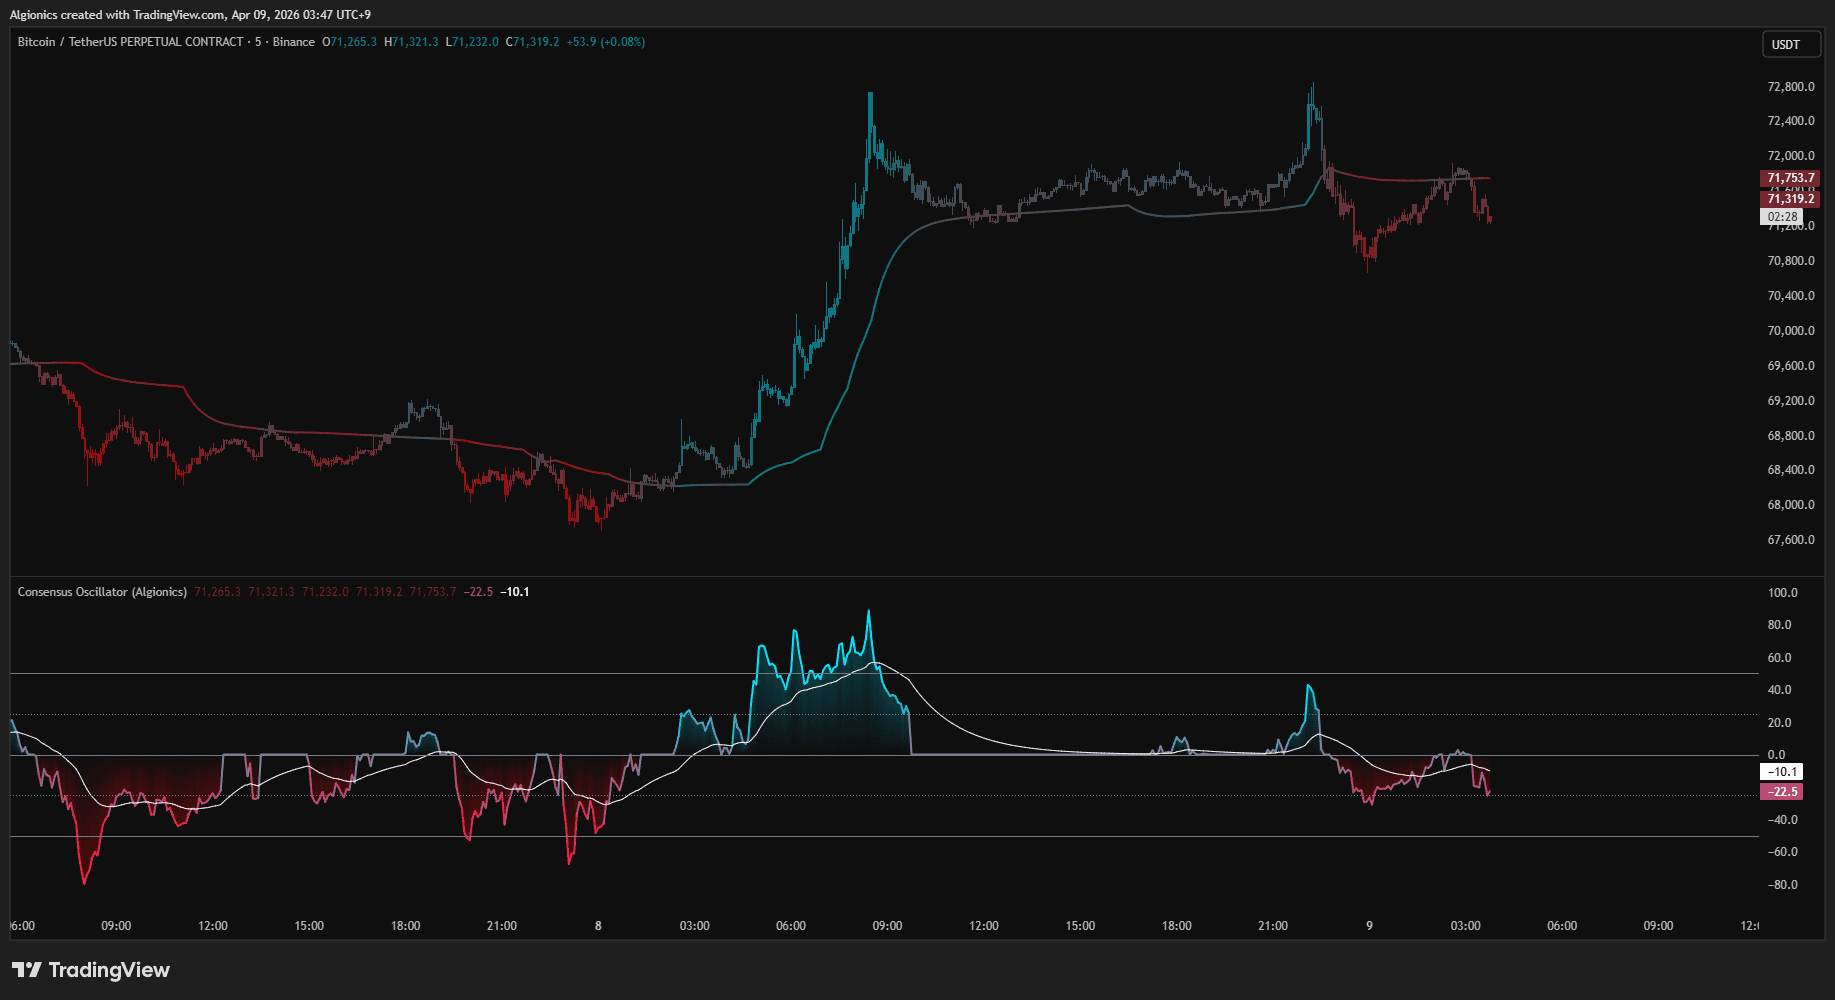
VPOC mode measures where the current price sits relative to the Volume Point of Control.
CA-M mode measures position relative to the Consensus Area midpoint. Both produce a normalized reading on the same scale.
Consensus mode combines both anchors. When VPOC and CA-M agree on direction, the output reflects their shared reading. When they disagree, the output compresses toward zero. This acts as a built-in coherence filter that only passes through signals where both anchors confirm each other.
The Scale
The oscillator maps price position onto a fixed scale where each level corresponds to a boundary in the band structure.
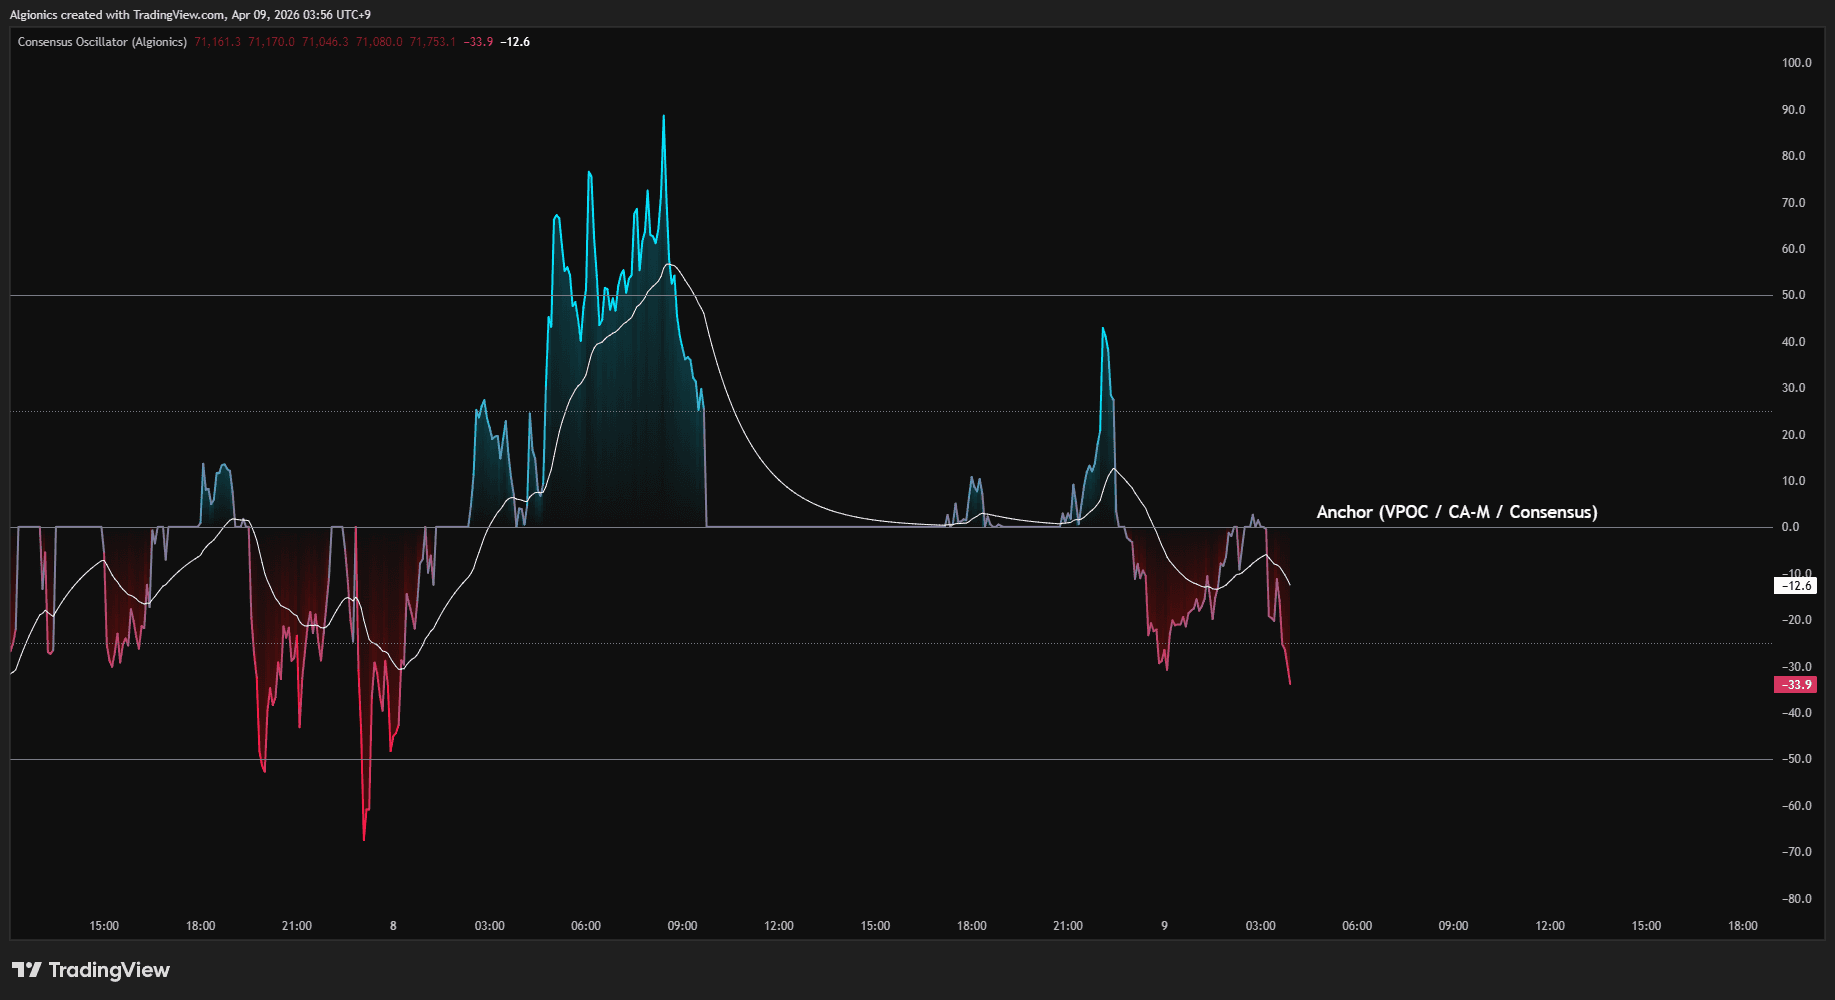
Zero marks the anchor. Positive values mean price is above it, negative values mean below. ±25 marks the Consensus Area edges. ±50 marks the Boundary Band edges.
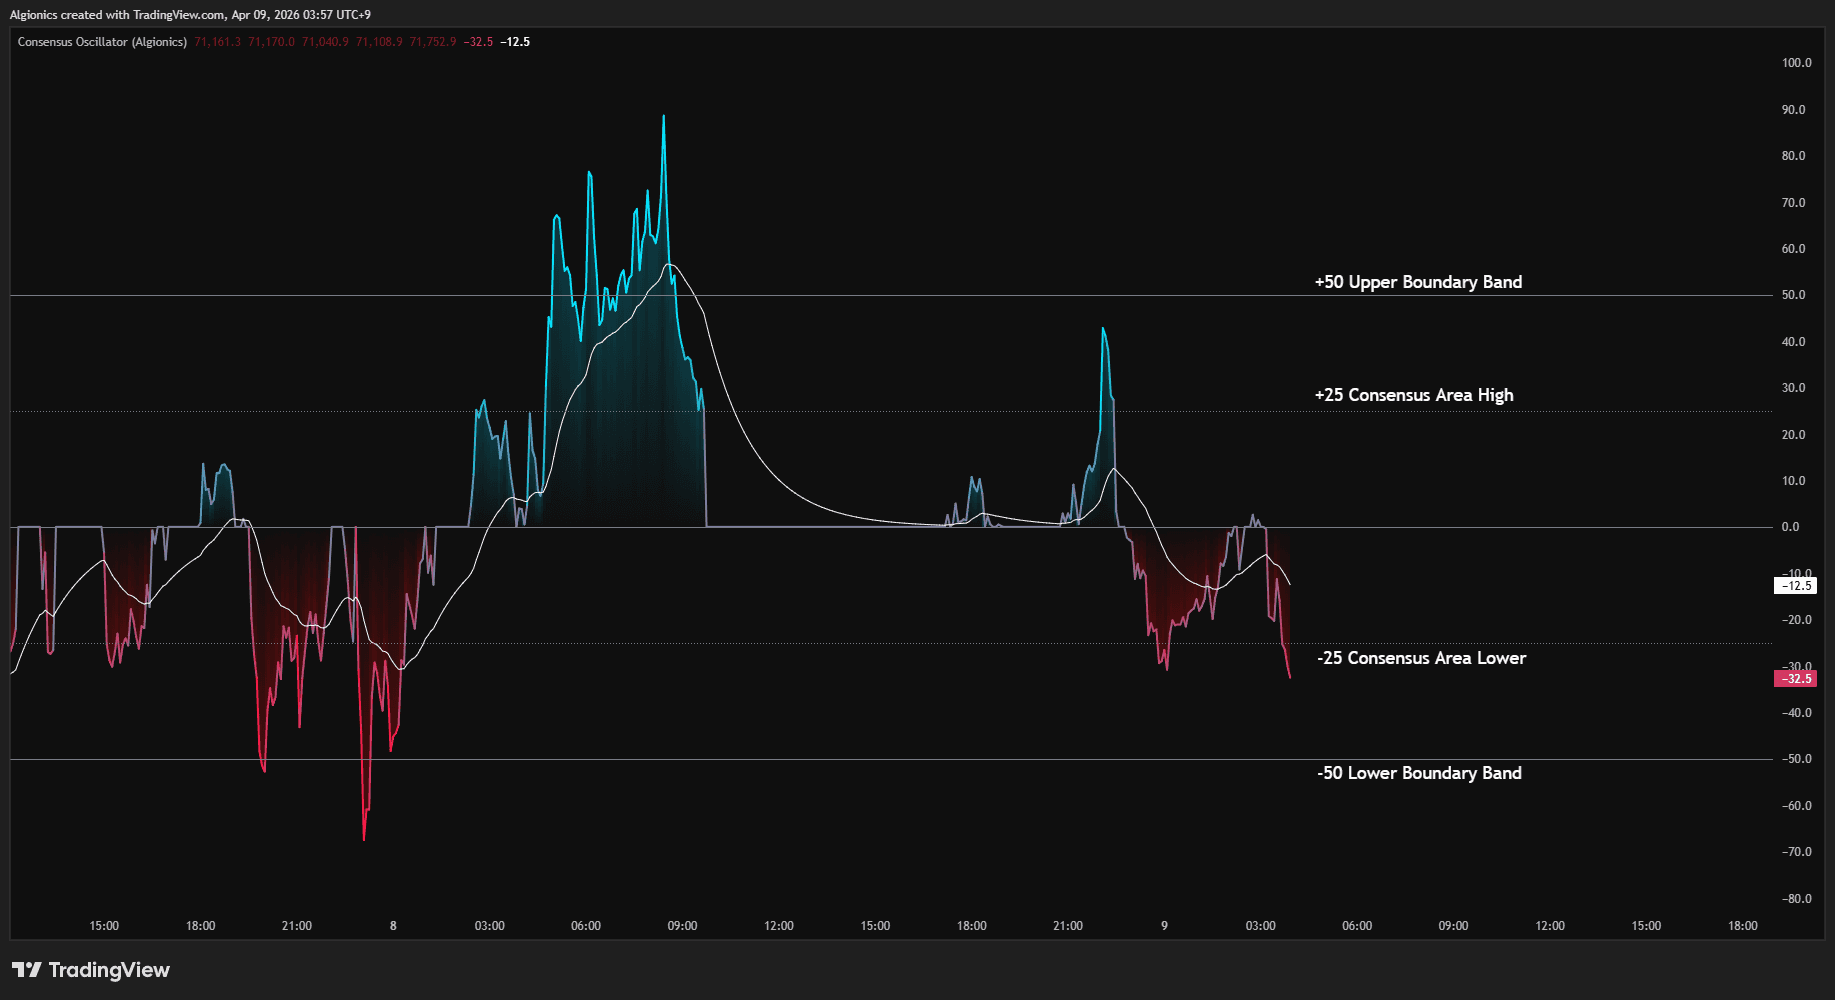
The scale itself is fixed, but the price levels behind it are not. The Consensus Area and Boundary Band are derived entirely from the volume profile's weighted distribution. They shift as the market moves. What ±25 and ±50 represent in price changes with every bar. The oscillator simply normalizes that moving structure into a consistent readable scale.
Between 0 and ±25, price is inside the Consensus Area. Between ±25 and ±50, price has left the consensus zone but remains within the statistical boundary. Beyond ±50, price is extended past ±2σ of the weighted volume distribution.
The normalization is asymmetric. The distance from the anchor to CA-H can differ from the distance to CA-L. Each side scales independently, so the reading reflects true proportional position rather than assuming symmetry.
Slow Line
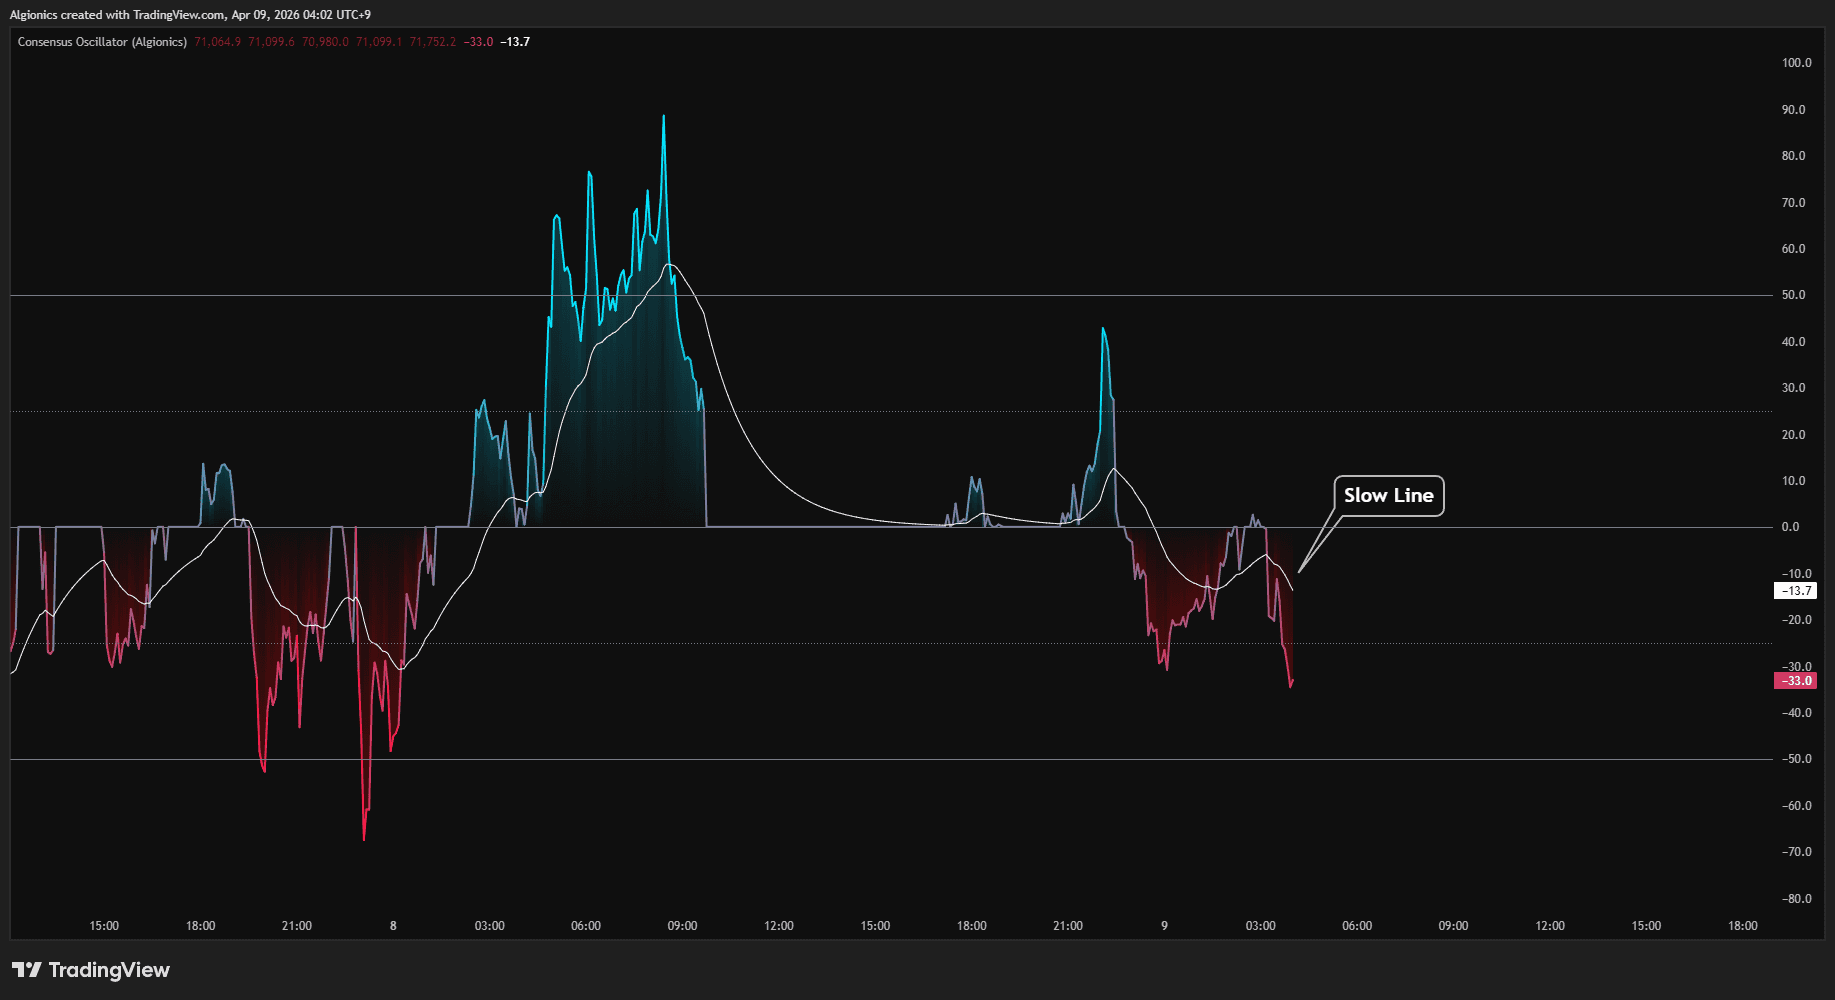
The Slow line is a smoothed version of the oscillator output. Three period options are available, all derived from the ribbon parameters.
Fast uses the square root of the ribbon maximum.
Medium uses the harmonic mean of the ribbon endpoints.
Slow uses the geometric mean. No arbitrary period is introduced.
The Slow line provides a reference for the oscillator's trend direction. When the oscillator crosses above the Slow line, momentum is shifting upward relative to its own average. When it crosses below, momentum is fading.
Fill
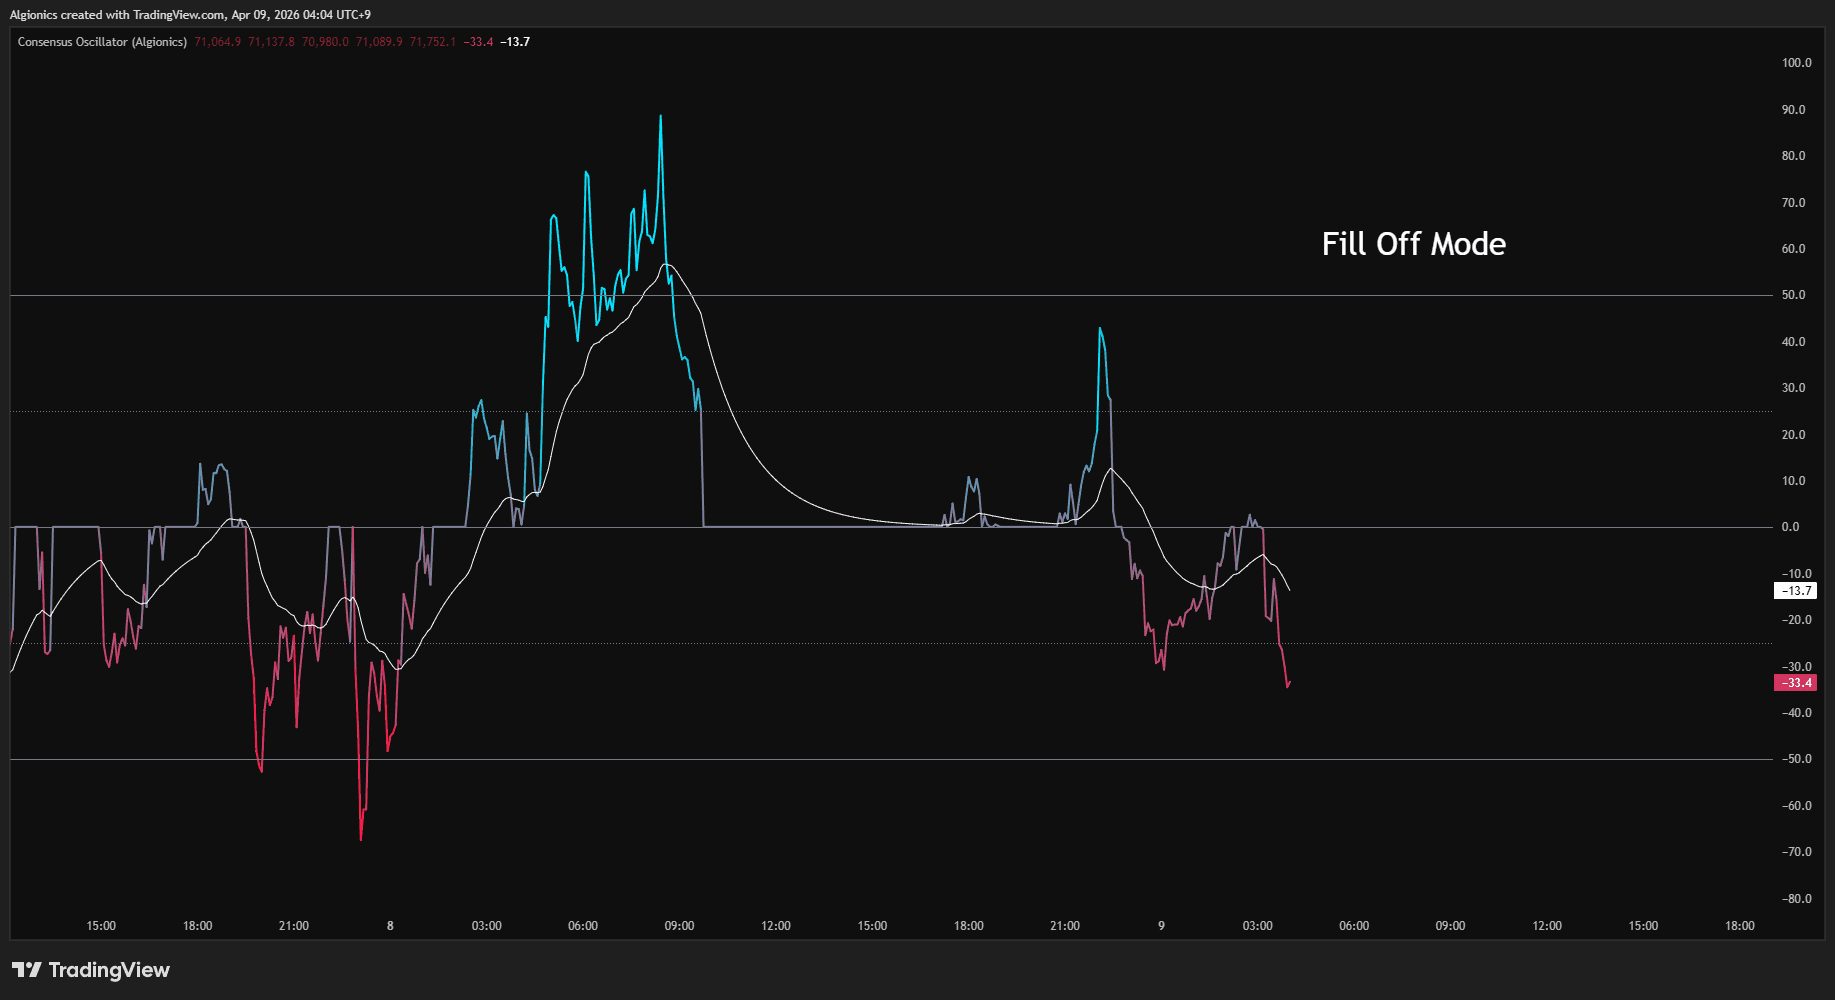
When Show Fill is enabled, gradient shading appears between the oscillator line and the zero line. The fill uses bull color above zero and bear color below, fading toward zero.
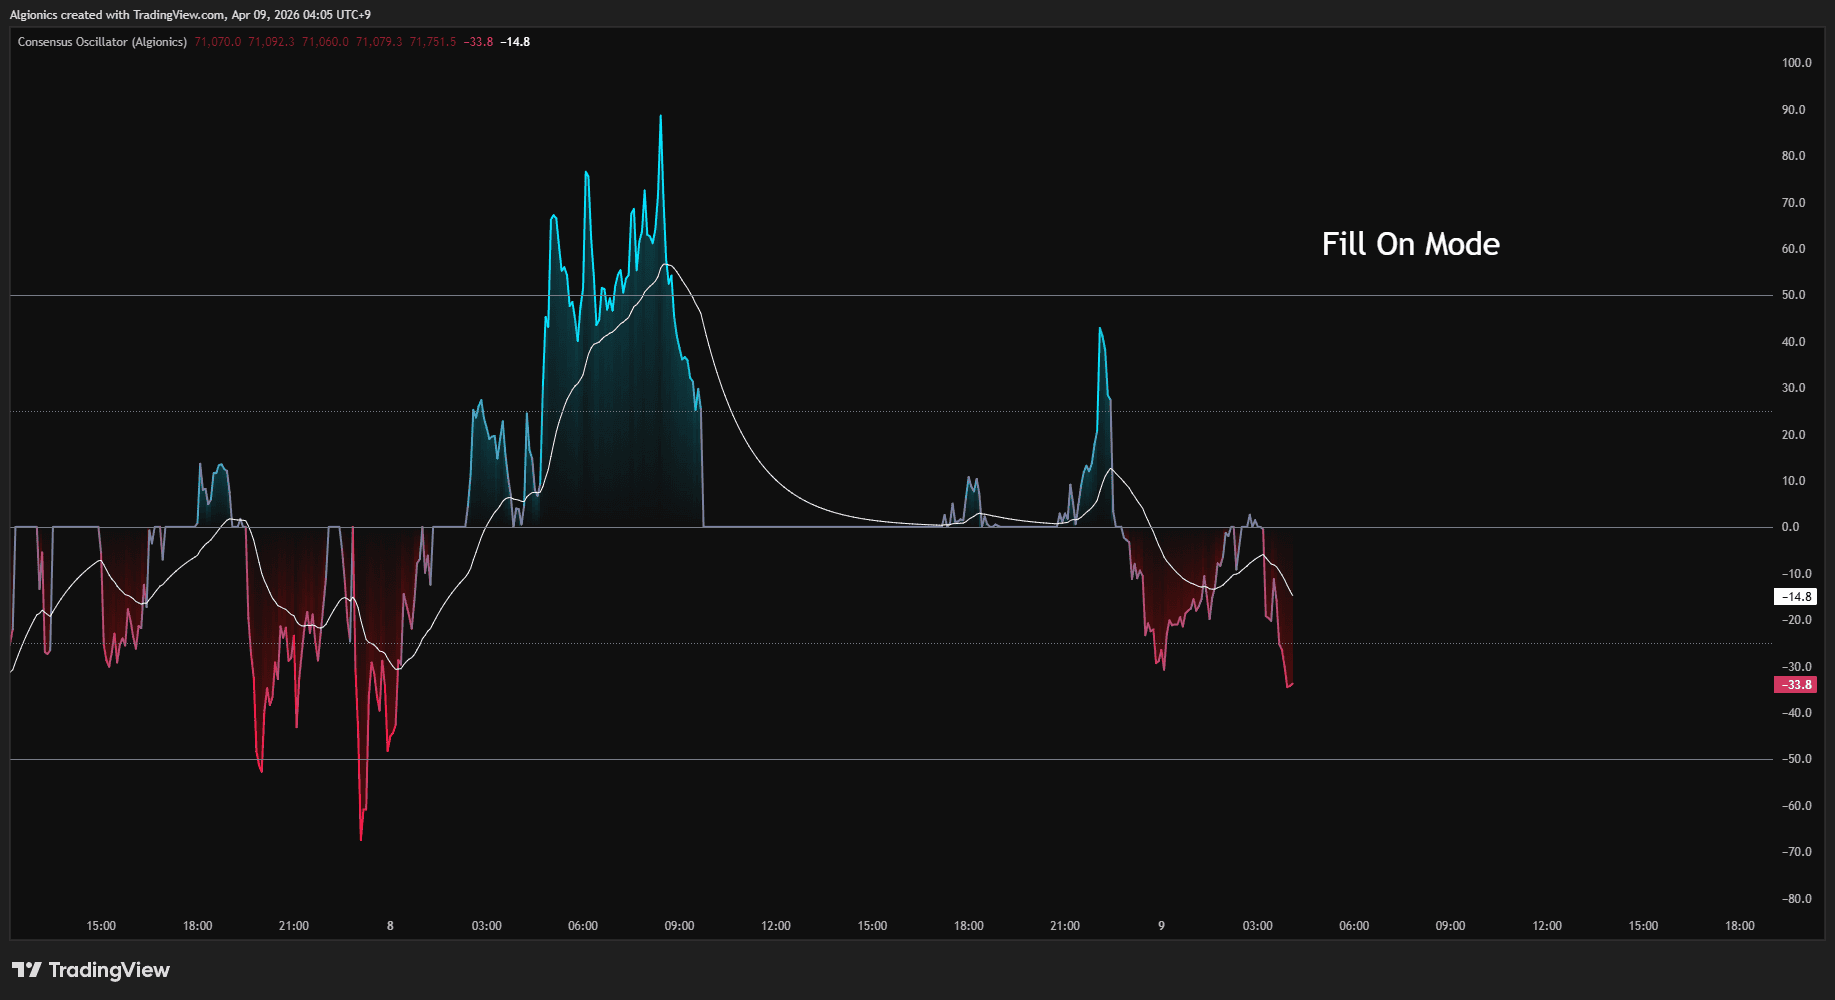
This gives a quick visual read on which side of the anchor price currently sits and how far it has moved.
Price Candles
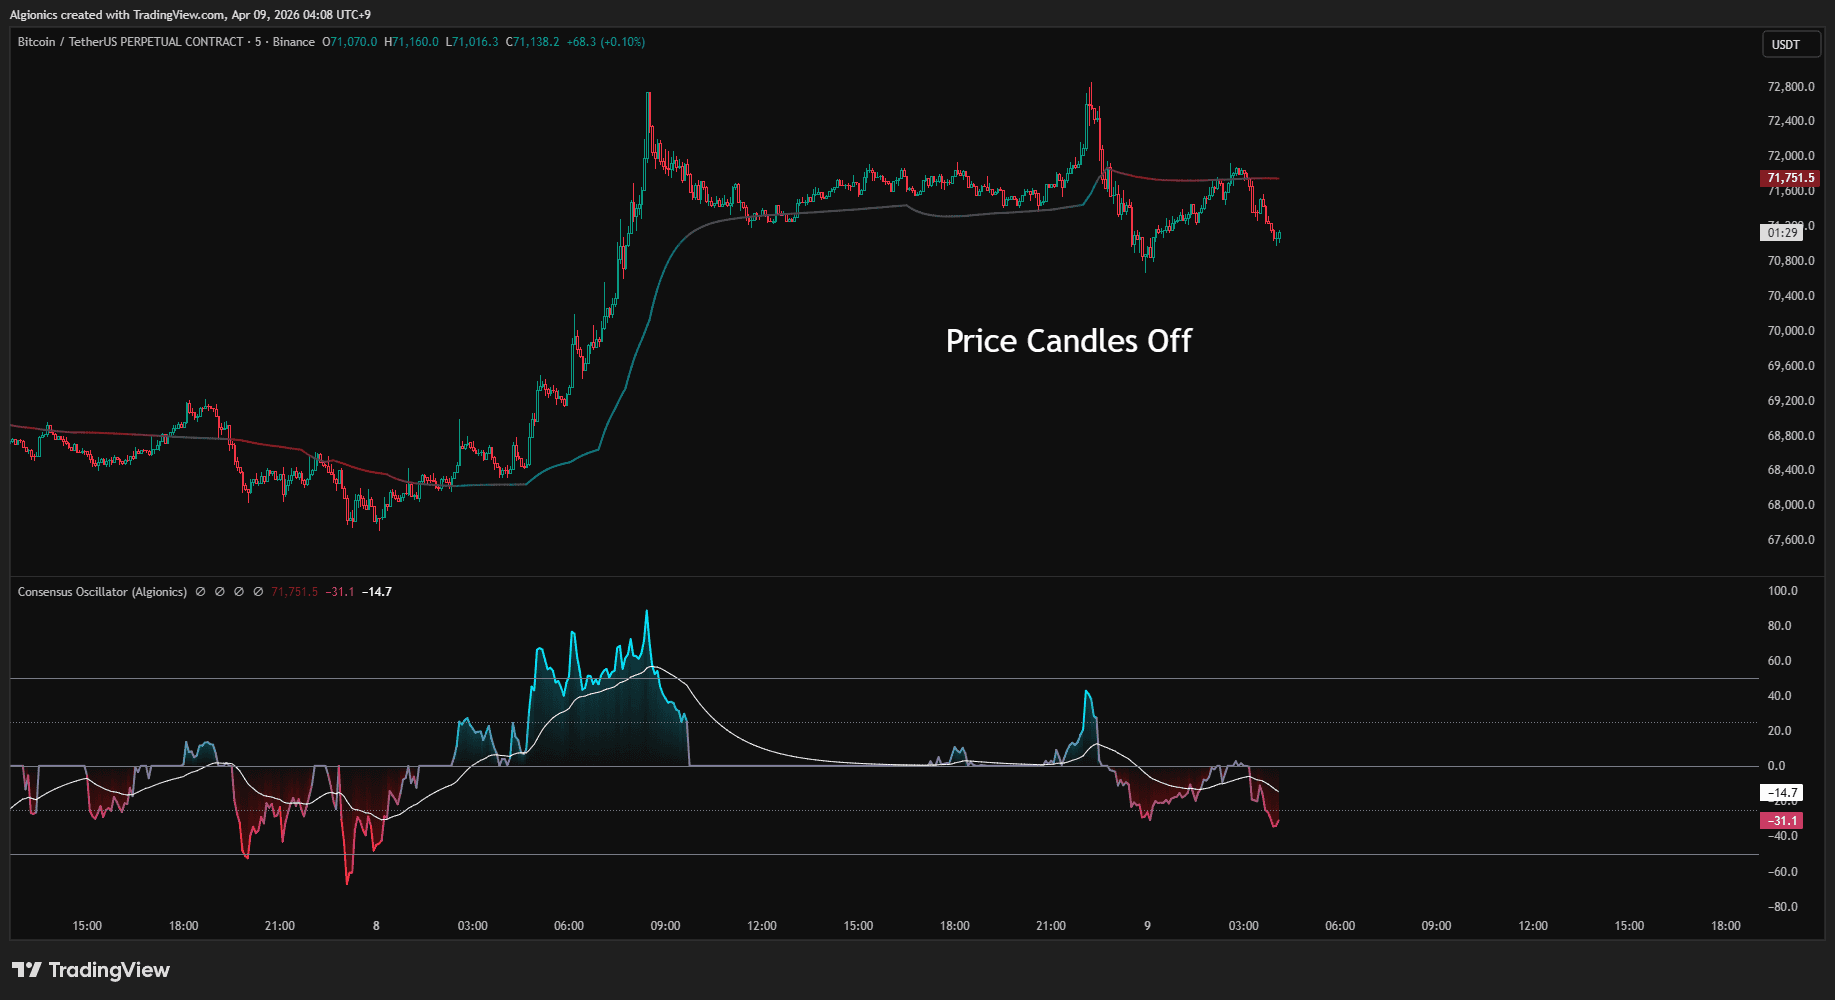
When enabled, price candles on the main chart are colored using the σ-Position gradient. Each candle's color reflects where the close sits within the band structure, shifting from bear color at the lower boundary to bull color at the upper boundary.
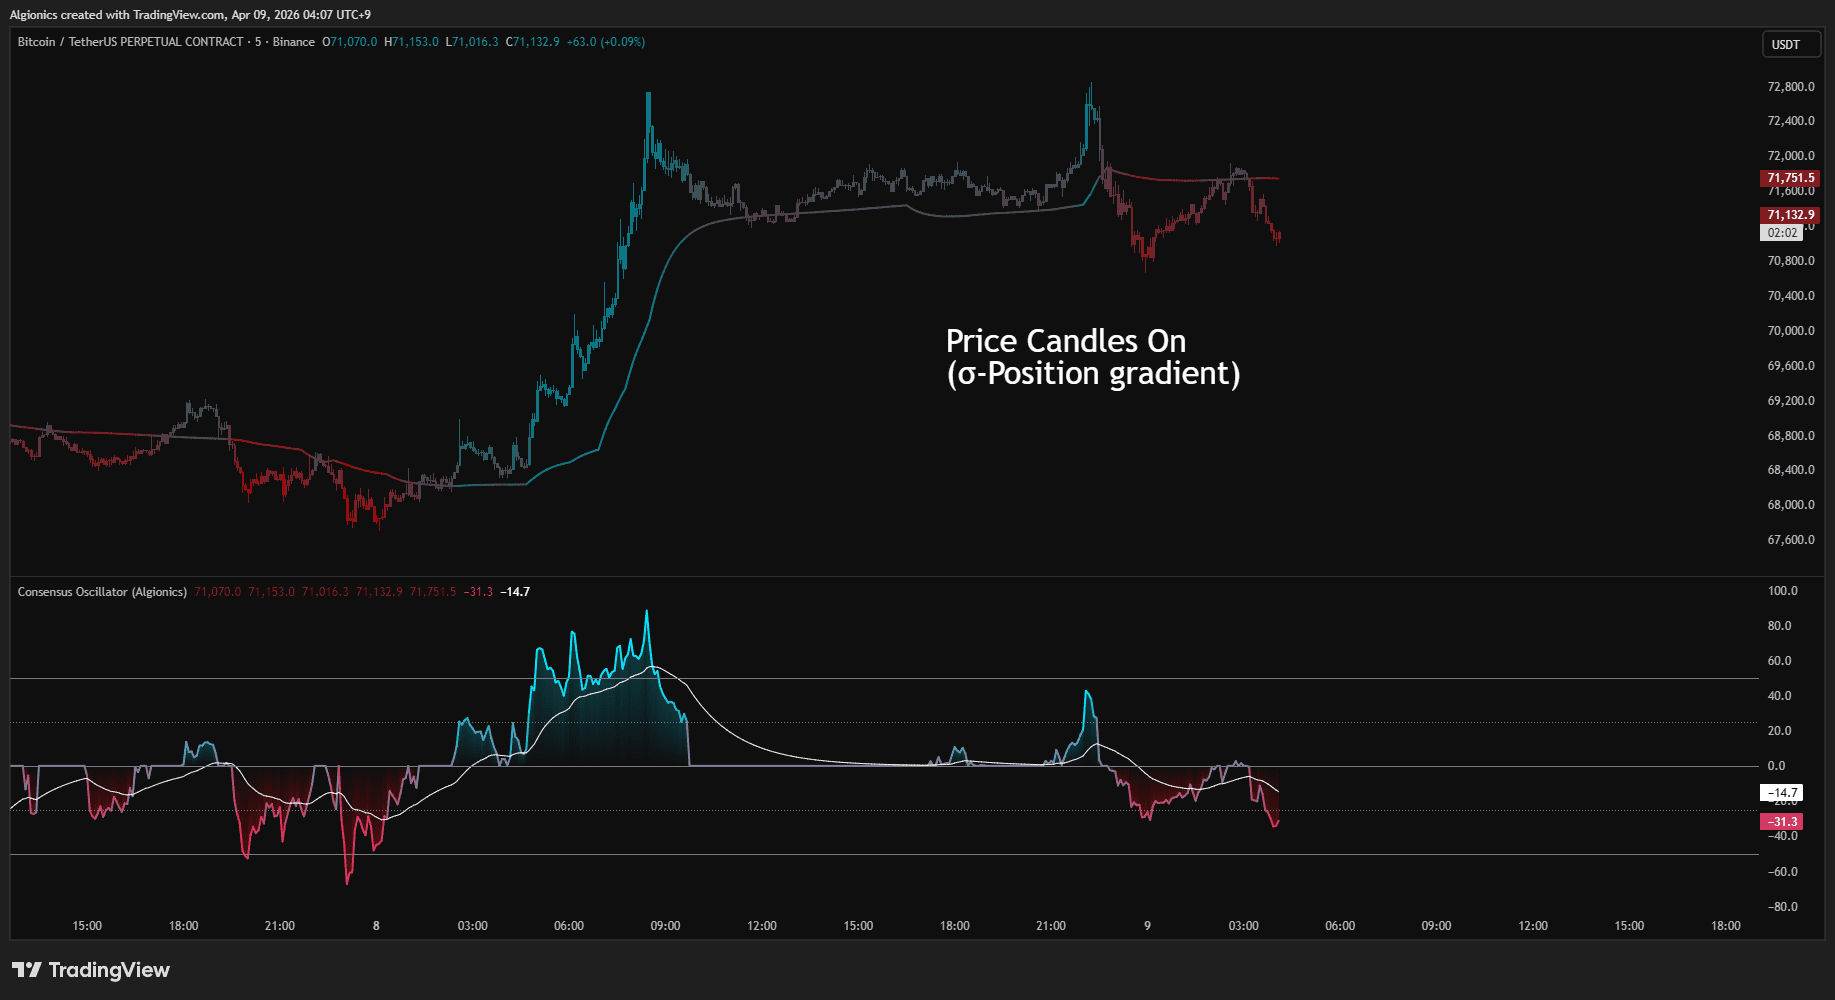
This is the same coloring system used in Consensus Band's Panel mode. The anchor used for the gradient follows the selected Mode.
Anchor Overlay
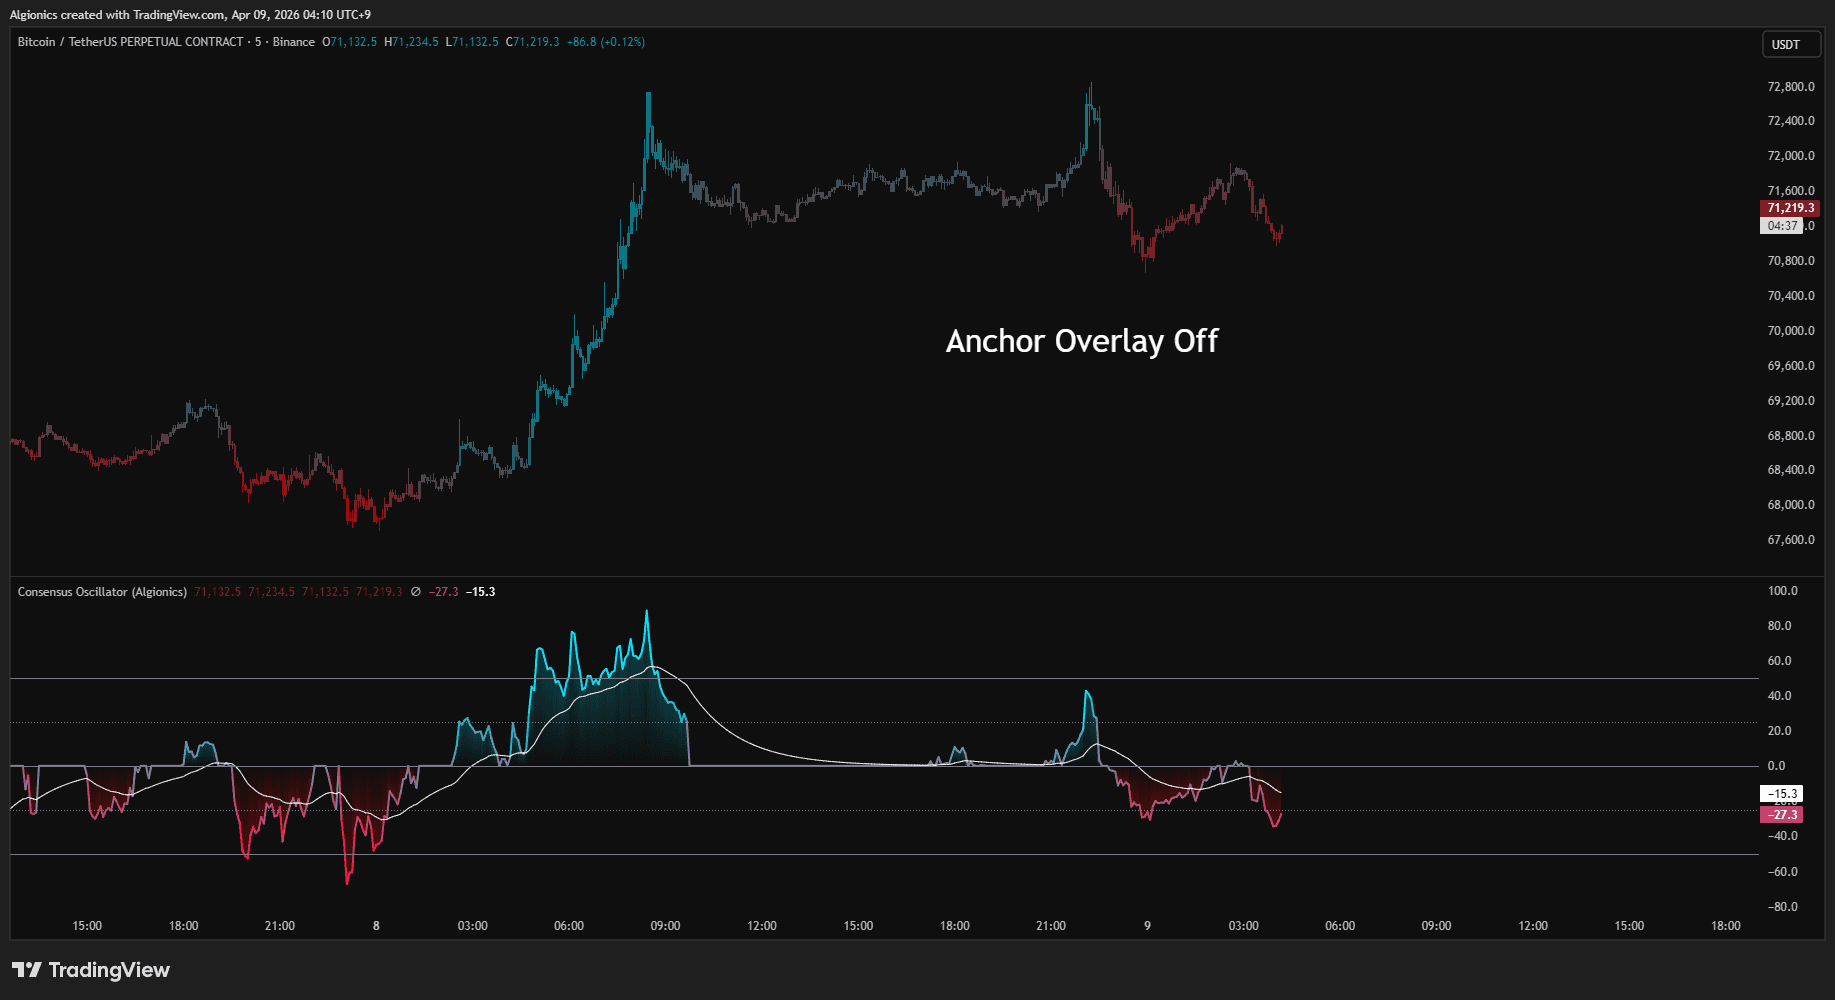
The Anchor line draws the active anchor price directly on the main chart. In VPOC mode it shows the VPOC, in CA-M mode it shows the Consensus Area midpoint, and in Consensus mode it shows the geometric mean of both.
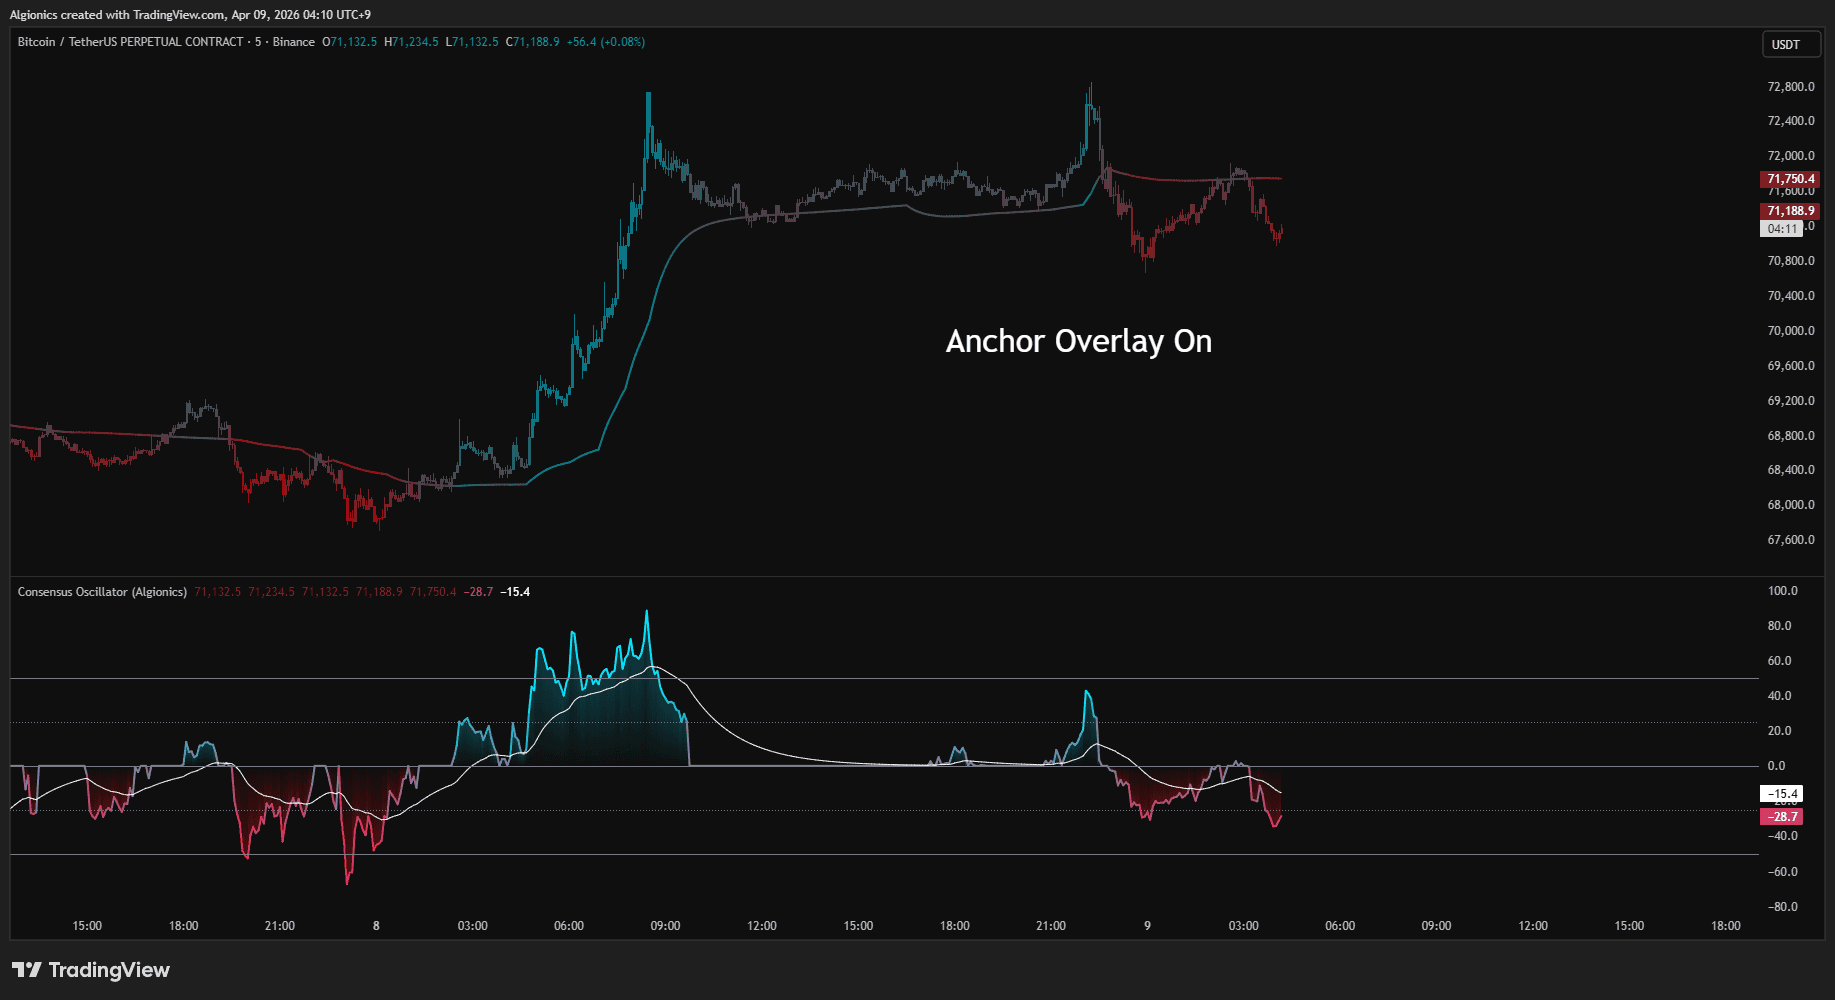
When Anchor Gradient is enabled, the line color shifts based on σ-Position. Near the upper boundary it turns toward bull color, near the lower boundary toward bear color. When disabled, the line uses a fixed neutral color.
Technical Identity
02
Piecewise Asymmetric Normalization
The oscillator does not divide price range into equal halves. The distance from the anchor to CA-H and from the anchor to CA-L are treated as separate spans. Each side is normalized independently.
Between the anchor and the Consensus Area edge, the reading maps to 0 to ±25. Between the Consensus Area edge and the Boundary Band edge, it maps to ±25 to ±50. This piecewise approach preserves the actual shape of the volume distribution rather than forcing it into a symmetric scale.
Dual-Anchor Coherence
Consensus mode runs both VPOC and CA-M oscillators simultaneously and combines them through a coherence filter.
The direction is the average of both readings. The coherence score measures how closely the two anchors agree, calculated from the ratio of their product to the sum of their squares.
When both point the same way with similar magnitude, coherence is high and the output passes through at full strength. When they conflict, coherence drops and the output compresses toward zero.
This means Consensus mode is not a simple average. It is a gated output that only fires when the two independent anchors confirm each other.
σ-Position
σ-Position measures where the current price sits within the band structure as a value from -1 to +1. The range from the anchor to BB-H defines the upper span, and from the anchor to BB-L defines the lower span. Each side scales independently.
This single value drives both the Price Candle coloring and the Anchor Overlay gradient. It is the same σ-Position system used in Consensus Band.
Shared Engine
Consensus Oscillator runs on the same volume profile engine as Consensus Band. Spectral volume weighting, log-space profiling, parabolic interpolation, the σ-derived band structure, and zero-configuration design are all identical. For full detail on the engine, see the Consensus Band documentation.
Derived Constants
Every numerical parameter in the oscillator traces back to the ribbon structure.
The smoothing length is the square root of the ribbon maximum. The three Slow line periods are the square root, harmonic mean, and geometric mean of the ribbon endpoints. No period is chosen by hand.
The same constant set that defines the lookback weights also defines every smoothing and display parameter in the system.
Settings
03
Consensus Oscillator Settings
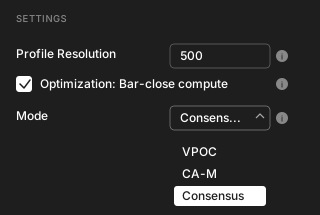
Profile Resolution controls how many price rows the volume profile uses. Higher values produce finer detail. The default is 500. Lower values may help performance on older devices.
Bar-close compute limits heavy calculations to confirmed bar closes and the current last bar. This reduces load without affecting output on completed bars.
Mode selects the oscillator anchor.
VPOC measures position relative to the Volume Point of Control.
CA-M measures position relative to the Consensus Area midpoint.
Consensus combines both through a coherence filter that only passes output when the two anchors agree.
Display
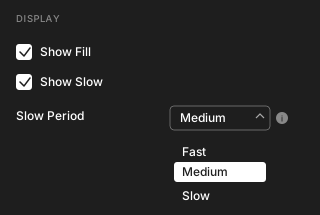
Show Fill toggles gradient shading between the oscillator line and the zero line.
Show Slow toggles the smoothed reference line.
Slow Period sets the smoothing length for the Slow line.
Fast uses the square root of the ribbon maximum.
Medium uses the harmonic mean of the ribbon endpoints.
Slow uses the geometric mean. All three values derive from the ribbon parameters.
Price Candles

Price Candles colors the candles on the main chart using the σ-Position gradient. The color shifts from bear color at the lower boundary to bull color at the upper boundary. The anchor used for the gradient follows the selected Mode.
Anchor Overlay
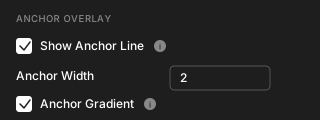
Show Anchor Line toggles the active anchor price on the main chart. In VPOC mode it shows the VPOC, in CA-M mode the Consensus Area midpoint, and in Consensus mode the geometric mean of both.
Anchor Width sets the thickness of the anchor line.
Anchor Gradient shifts the line color based on σ-Position. When disabled, the line uses a fixed neutral color.
Color Settings
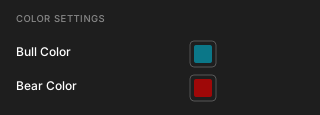
Bull Color sets the color used for positive values and the upper range of the σ-Position gradient.
Bear Color sets the color used for negative values and the lower range of the σ-Position gradient.
Tips
04
Reading Oscillator Divergence from Slow
When the oscillator moves sharply away from the Slow line, the gap between them widens. A narrowing gap suggests the move is losing momentum and the oscillator is reverting toward its own average. The wider the separation, the more extended the current move.
Combining with Consensus Band
Running Consensus Band and Consensus Oscillator on the same chart gives two complementary views of the same engine. The band shows where the levels are in price space. The oscillator shows where price sits within that structure as a normalized reading. Use the band for context and the oscillator for timing.
Mode Selection
VPOC mode responds to the single strongest volume concentration. CA-M mode responds to the broader distribution center. Consensus mode requires both to agree before producing output. In choppy conditions, Consensus mode stays near zero and filters out noise. In trending conditions, VPOC or CA-M may give earlier reads since they do not require confirmation from the other anchor.