Consensus Band
A practical guide to reading the band structure and its levels on your chart.
Reading the Band
01
Overlay and Panel Mode
Consensus Band is available in two display modes.
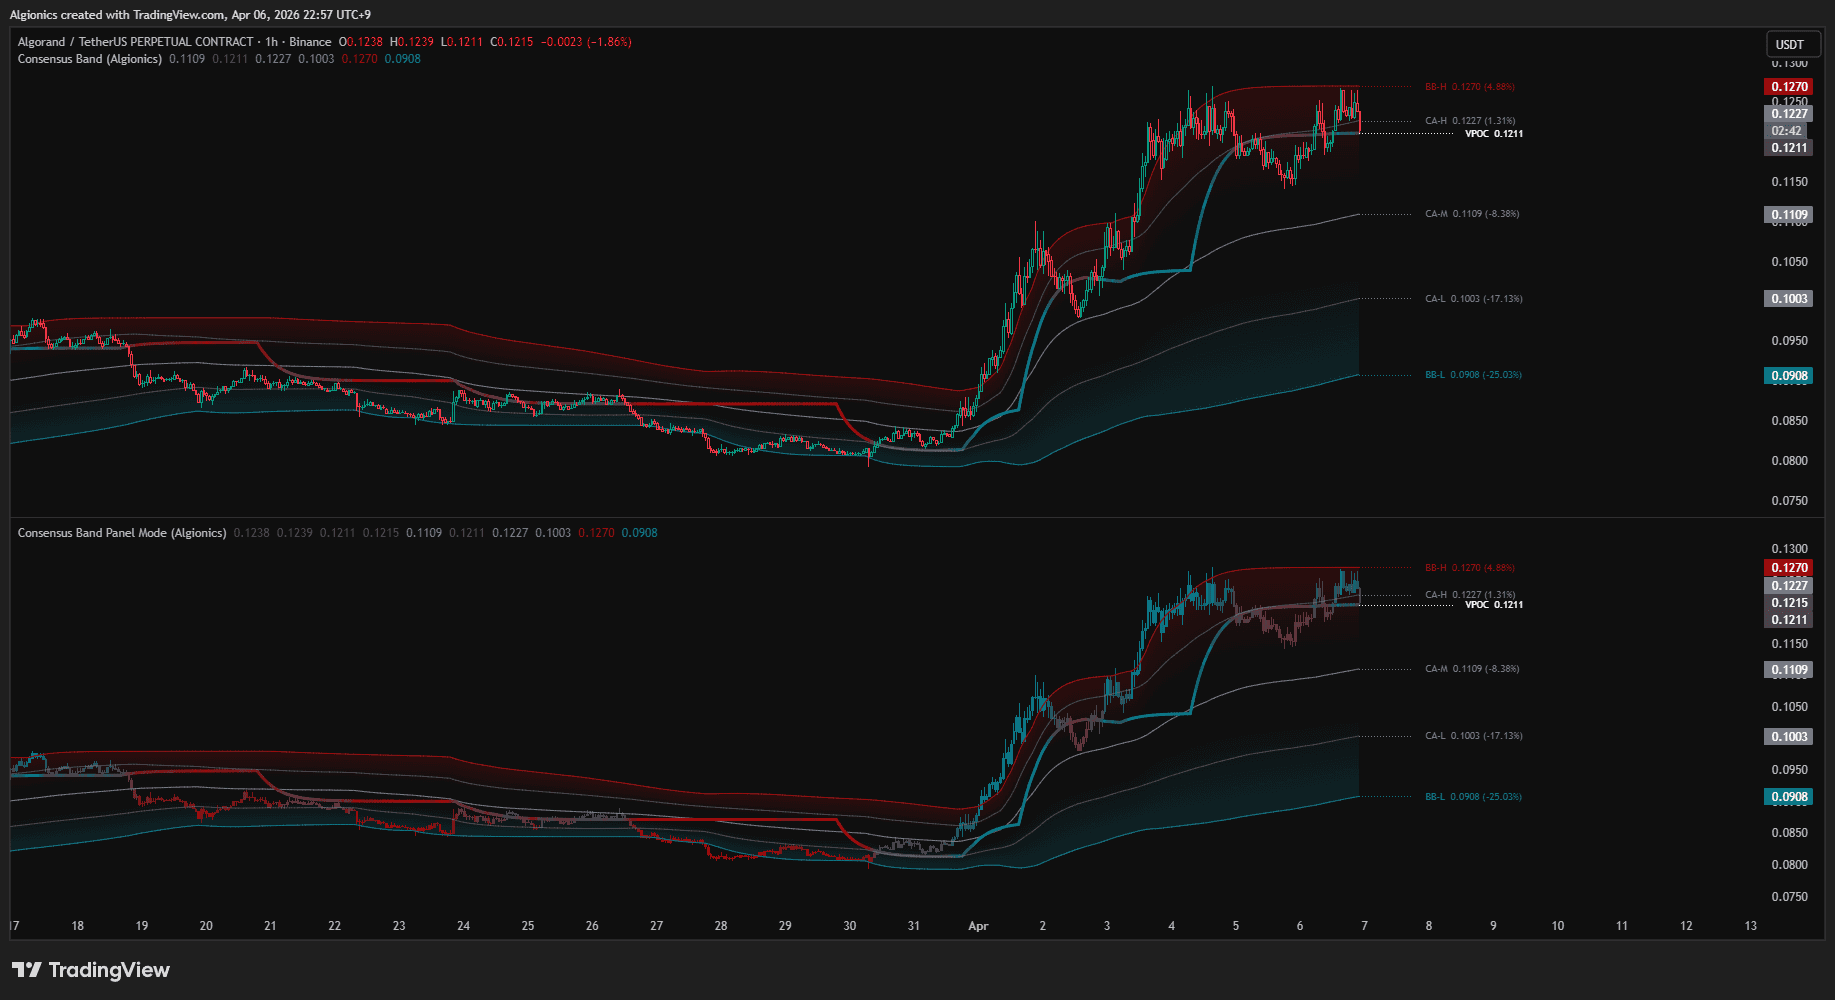
Overlay mode draws the band structure directly on your price chart. Panel mode opens a separate panel below the chart.
In Panel mode, candles are redrawn with σ-Position coloring. Each candle's color reflects where the close sits within the band, shifting from bear color at the lower boundary to bull color at the upper boundary.
Both modes use the same engine and produce identical levels. You can run both on the same chart simultaneously.
VPOC
The VPOC line marks the price level with the highest weighted volume over the lookback range.
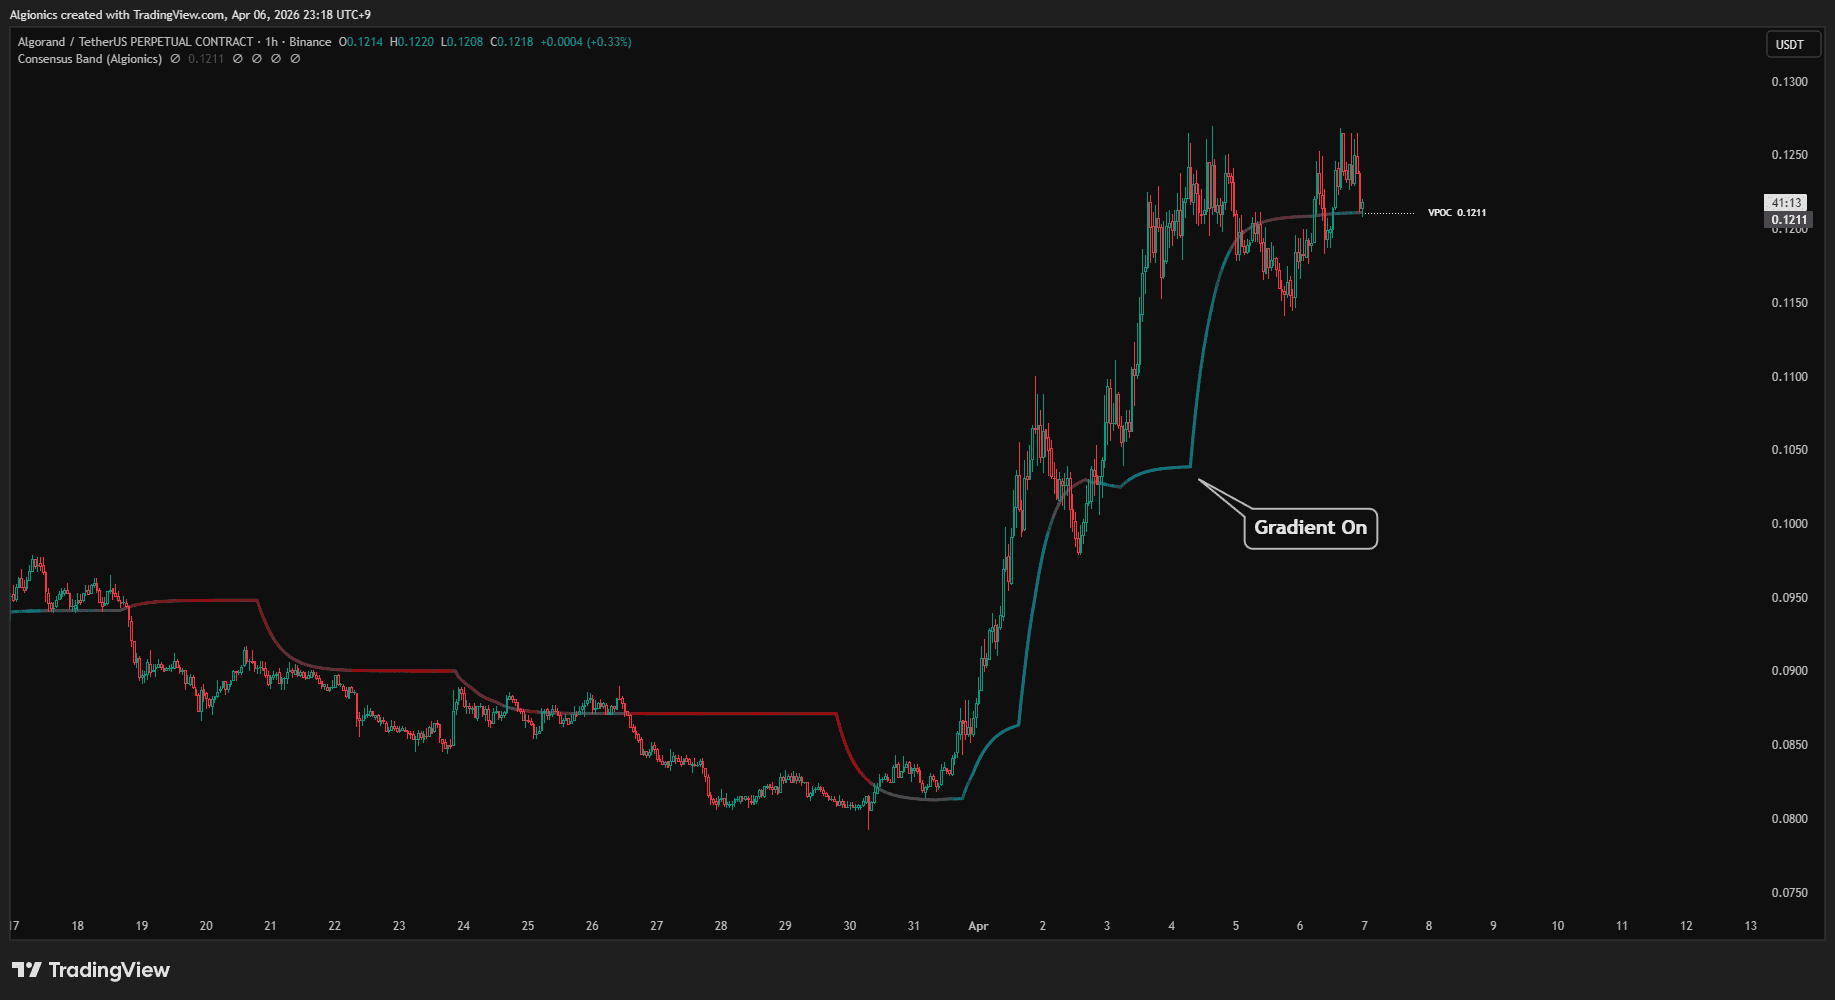
When VPOC Gradient is enabled, the line color shifts based on where the current price sits within the band. Near the upper boundary it turns toward bull color, near the lower boundary toward bear color.
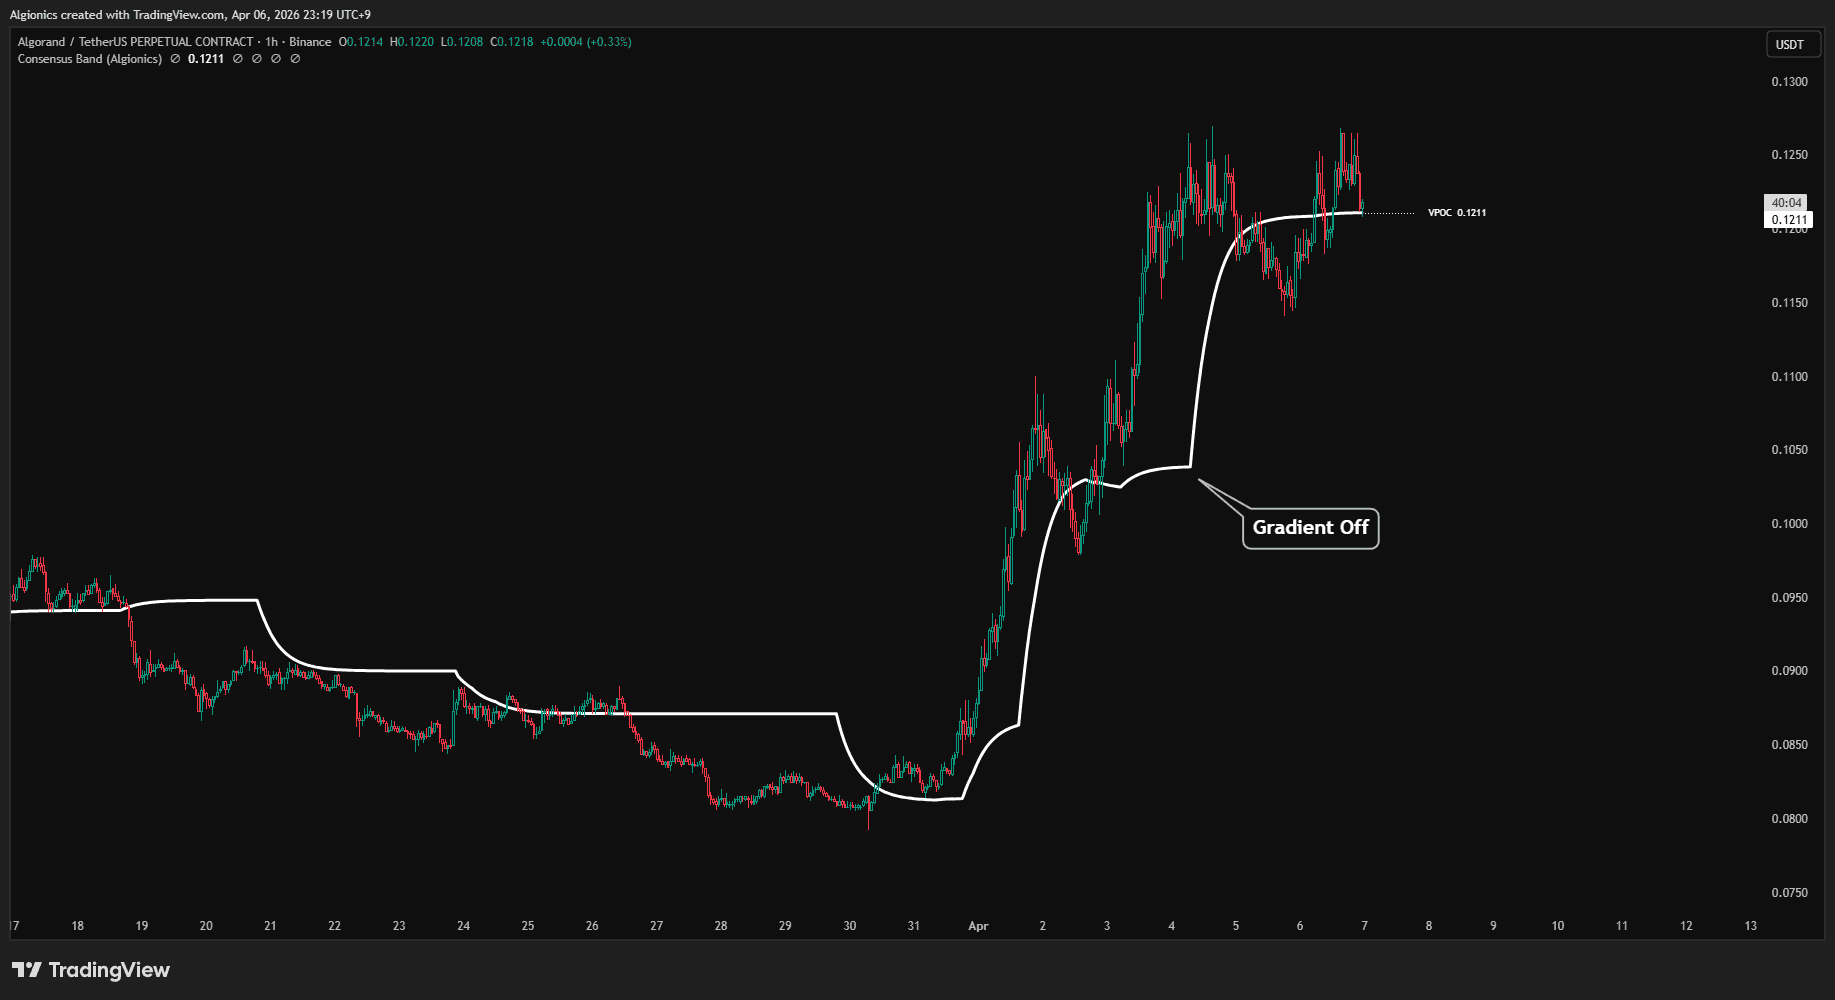
When disabled, the line uses a fixed color.
Consensus Area
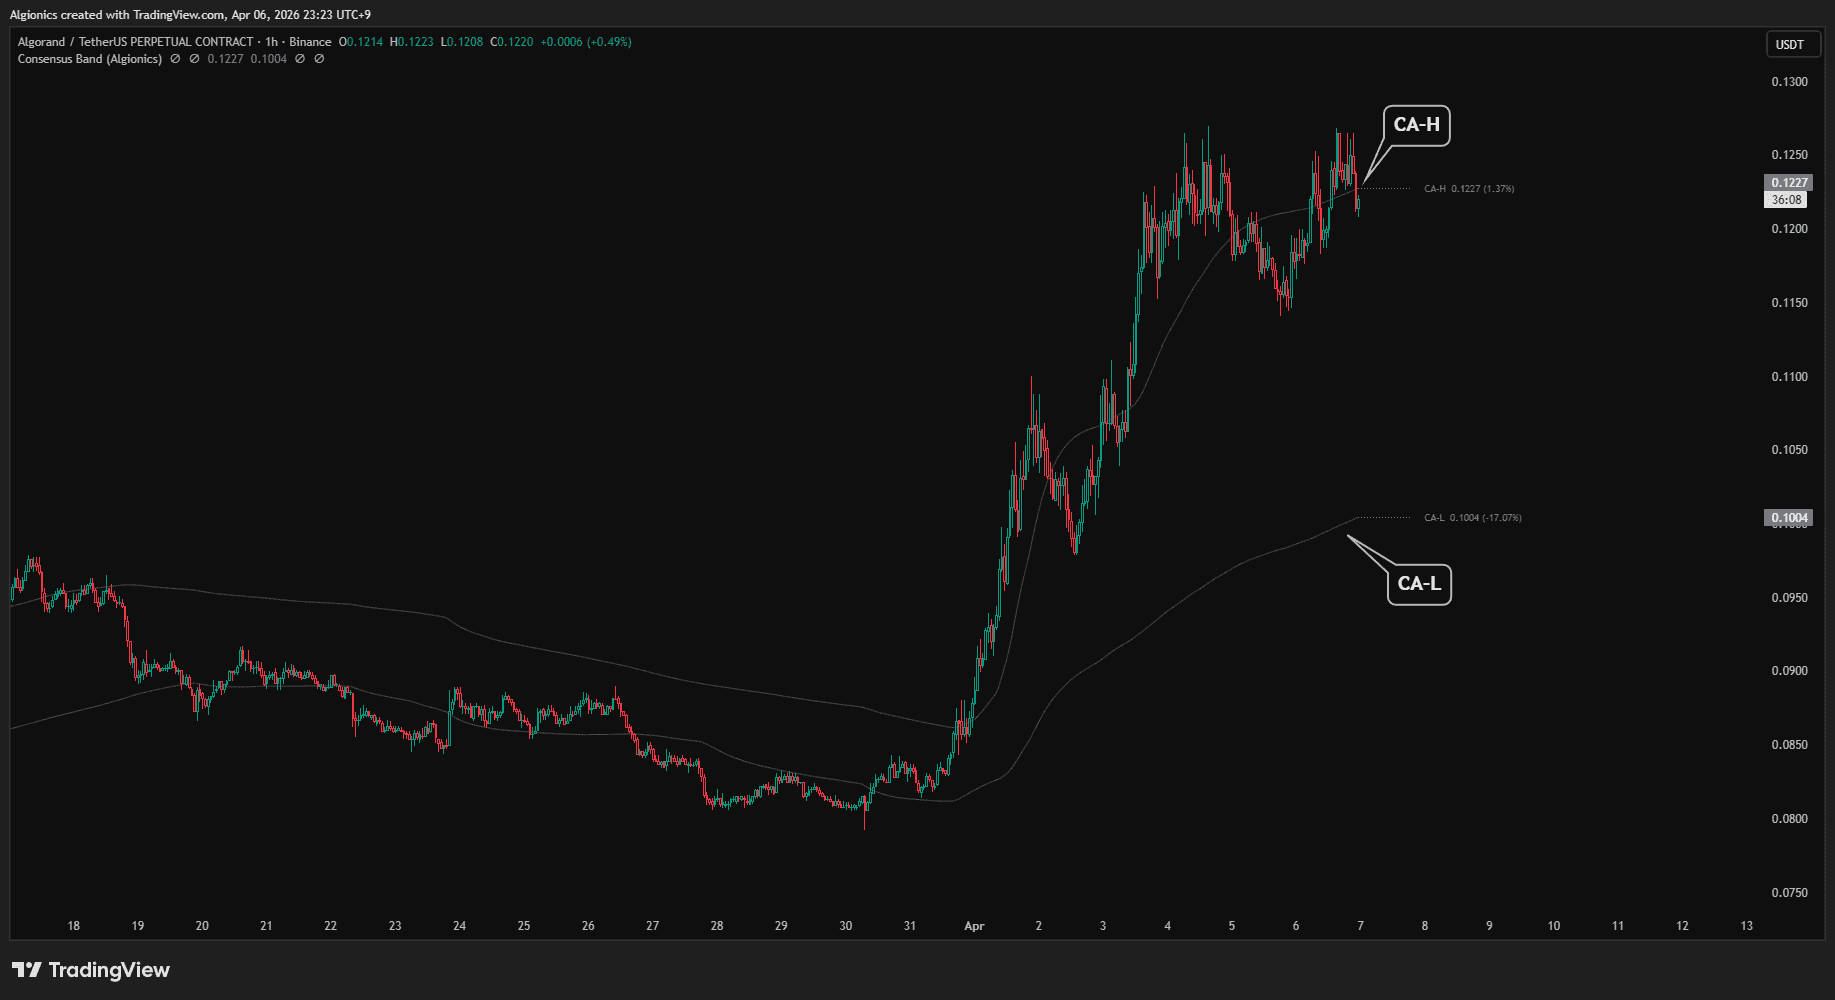
CA-H and CA-L mark the ±1σ range around the volume-weighted mean. This is where the majority of weighted volume concentrates.
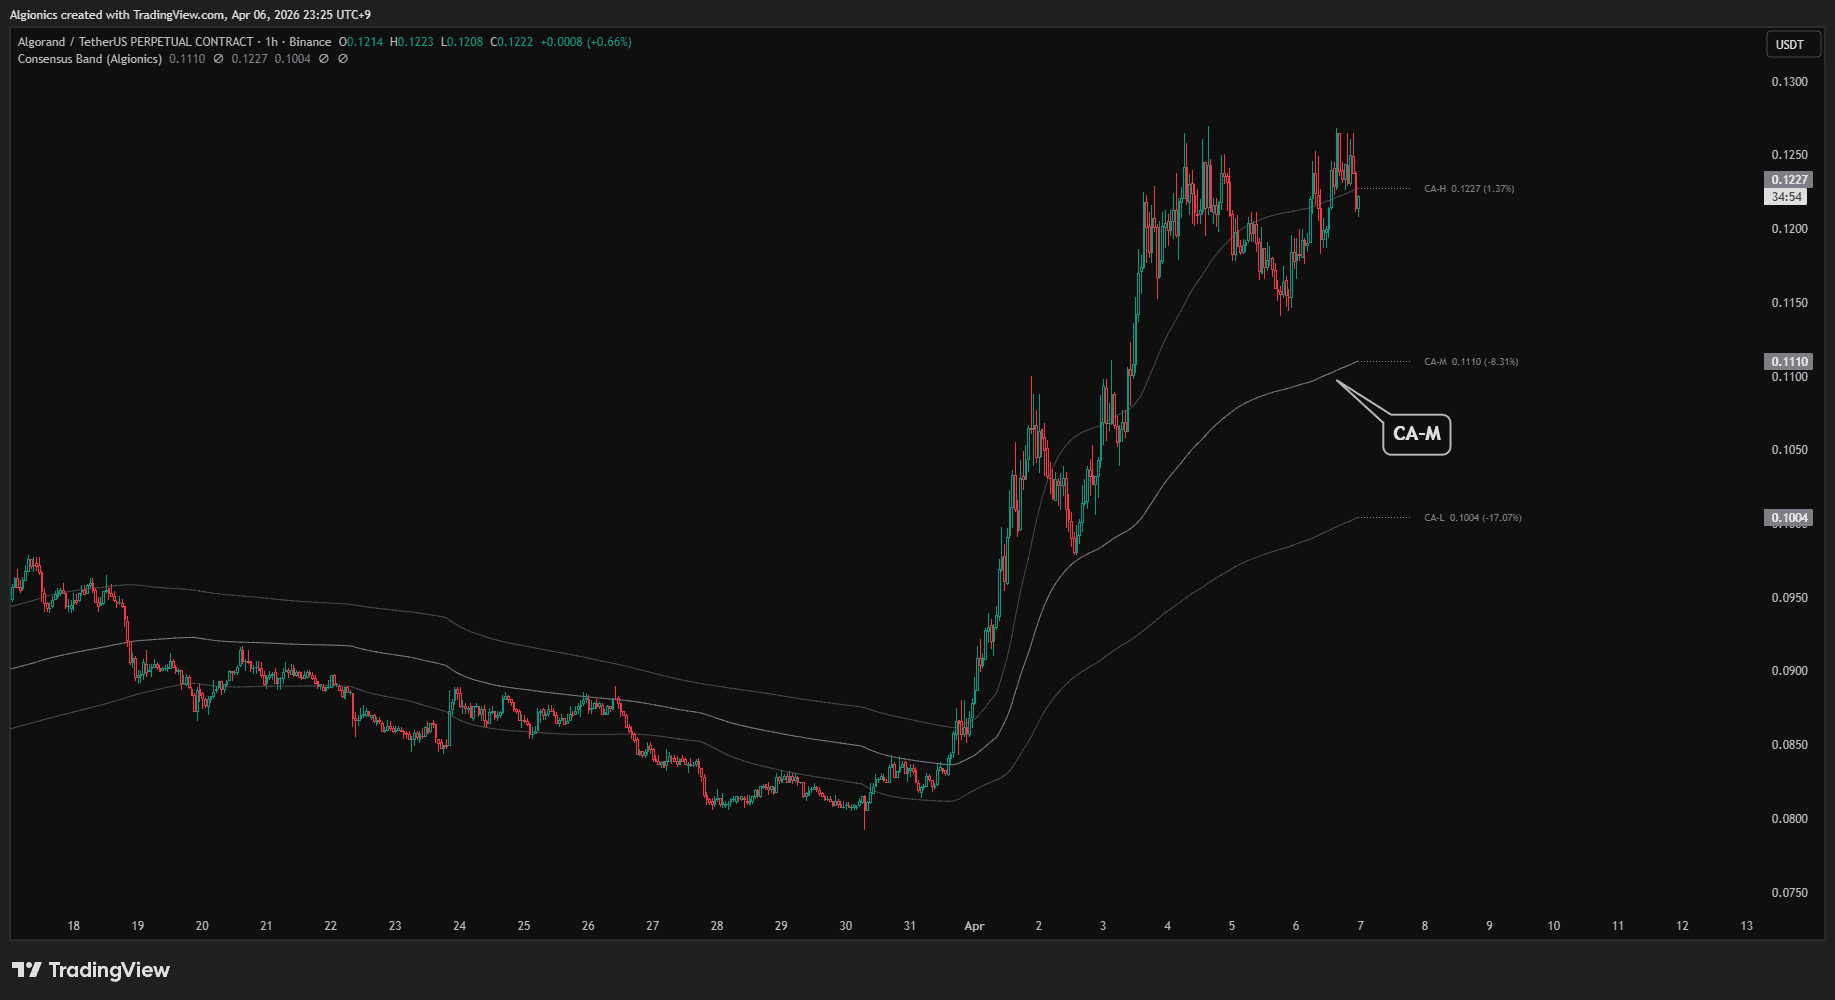
CA-M is the geometric midpoint between CA-H and CA-L, calculated as √(CA-H × CA-L). This preserves proportional symmetry in log space.
Boundary Band
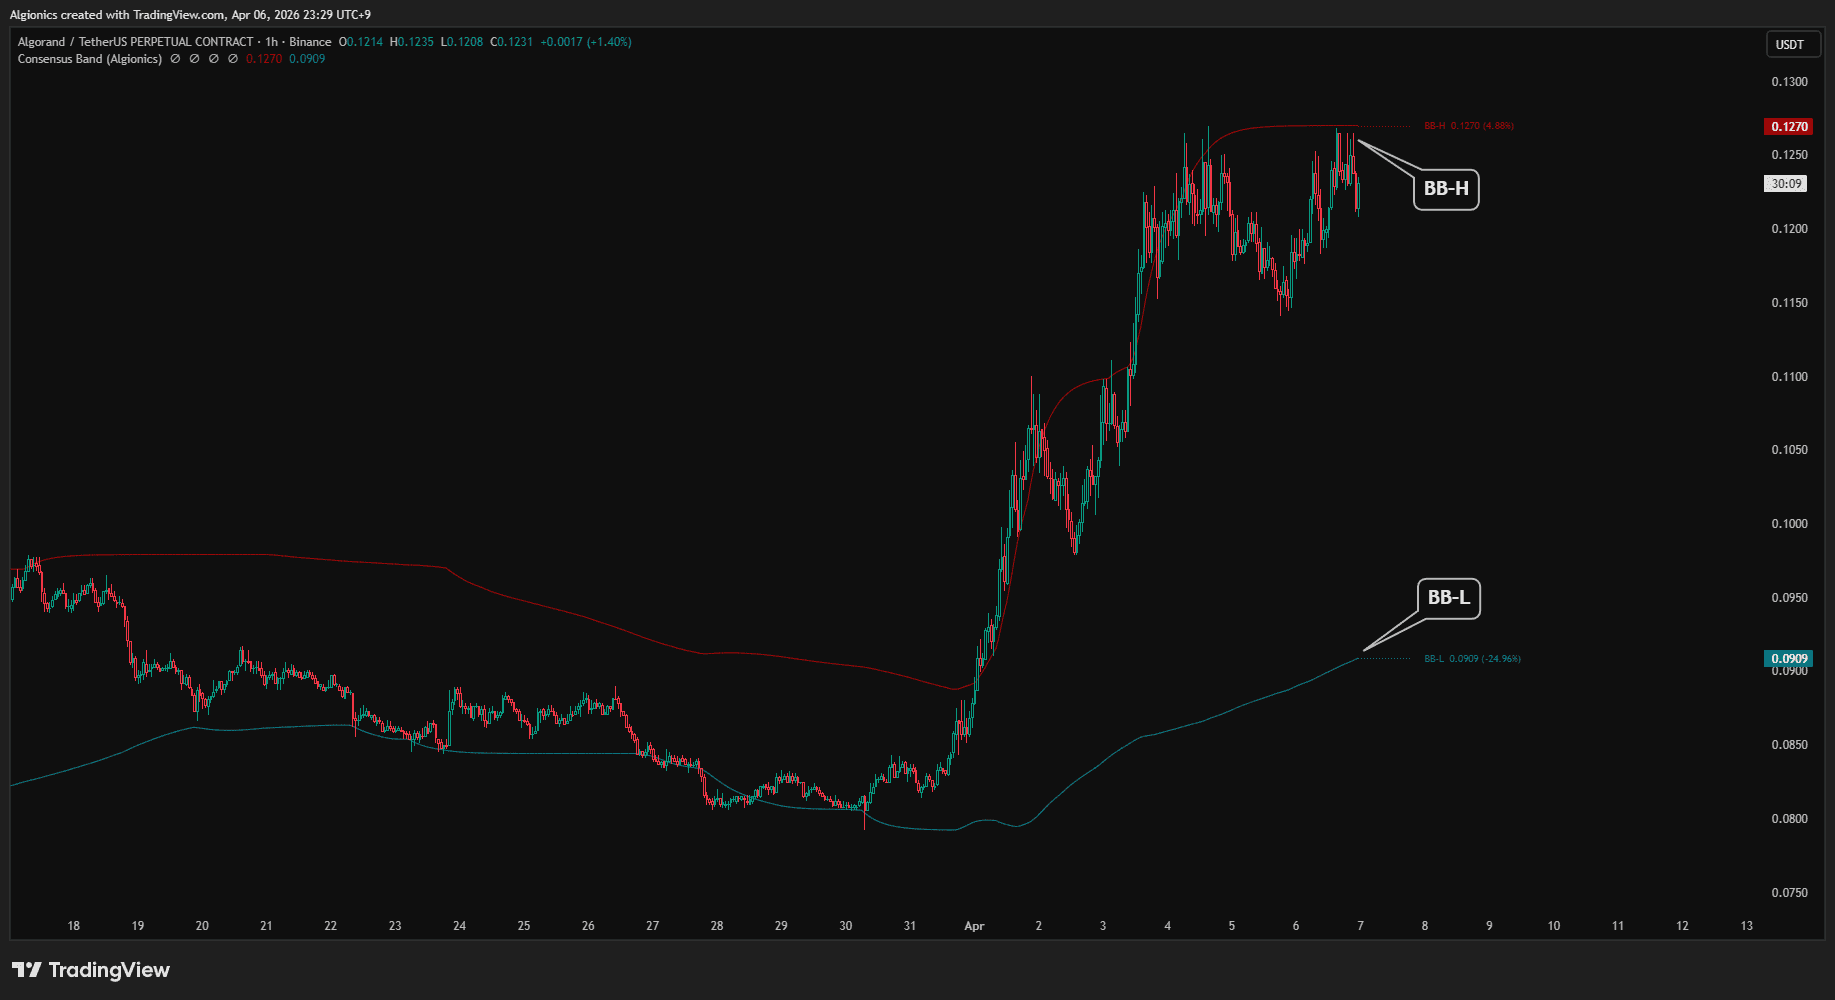
BB-H and BB-L mark the ±2σ range. Price beyond this range is statistically extended relative to the weighted volume distribution.
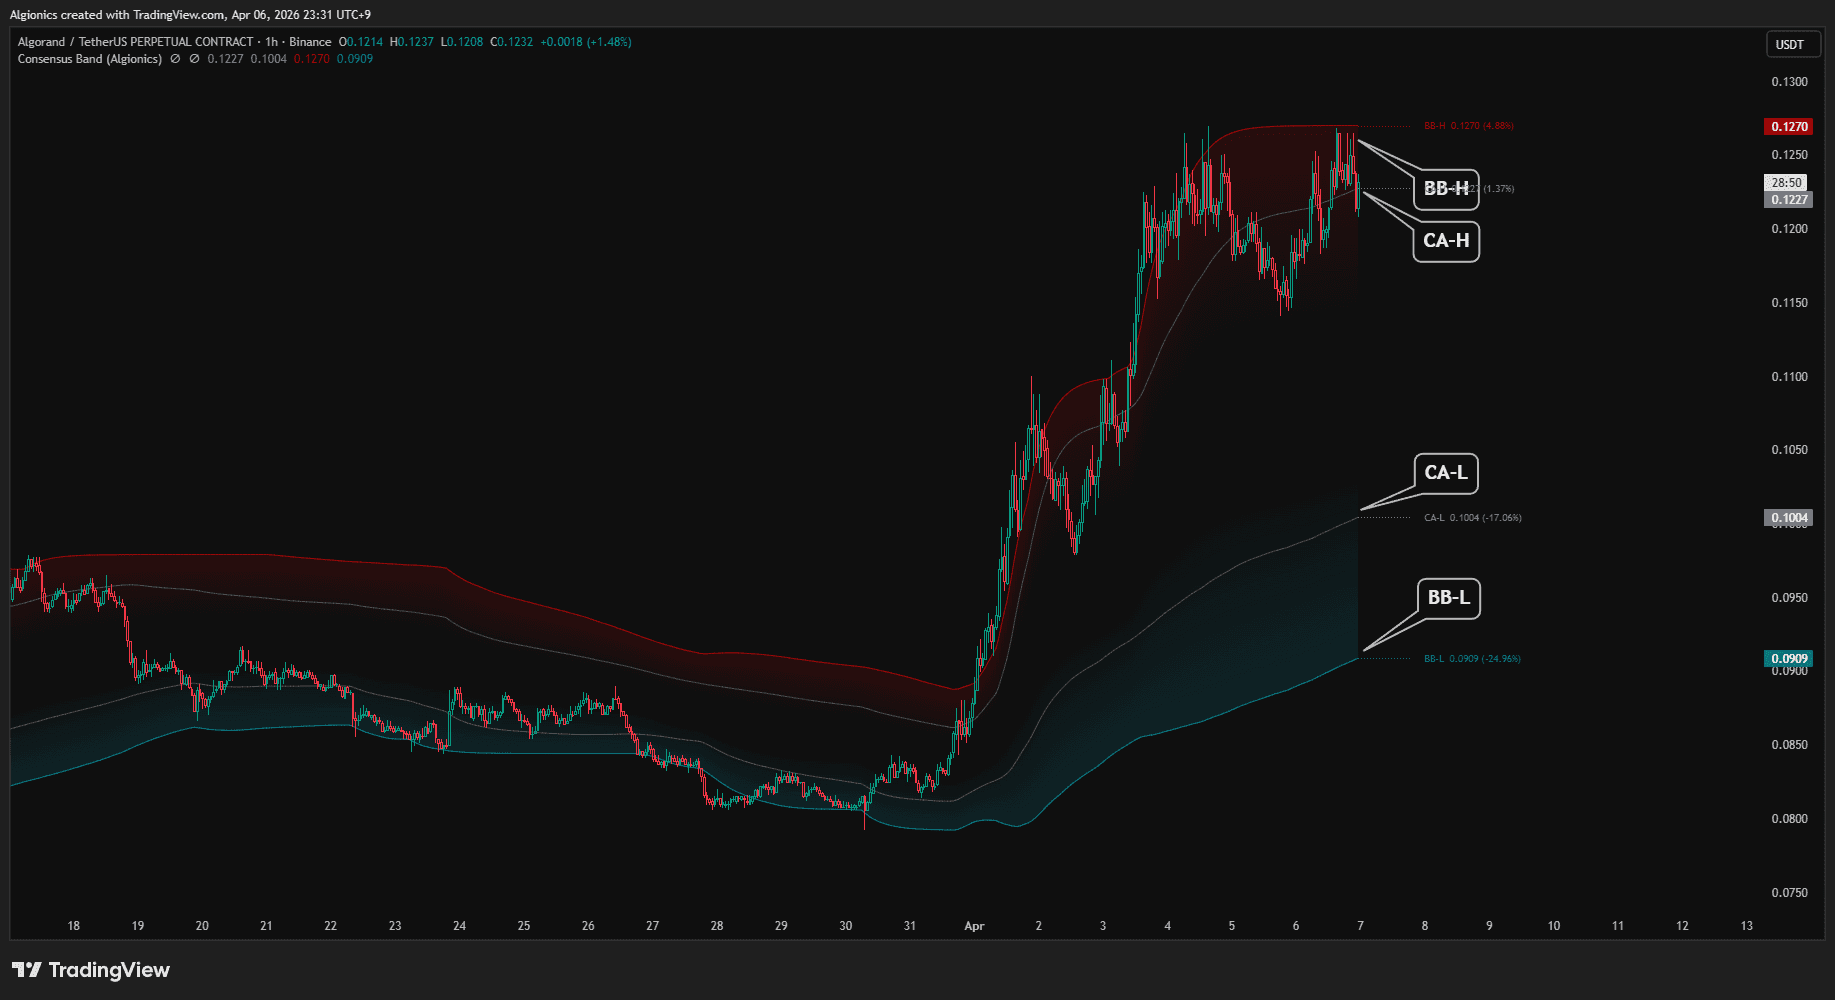
When Show Fill is enabled, gradient shading appears between the Boundary Band and the Consensus Area. The upper zone shades in bear color, the lower zone in bull color.
Extension Lines and Labels
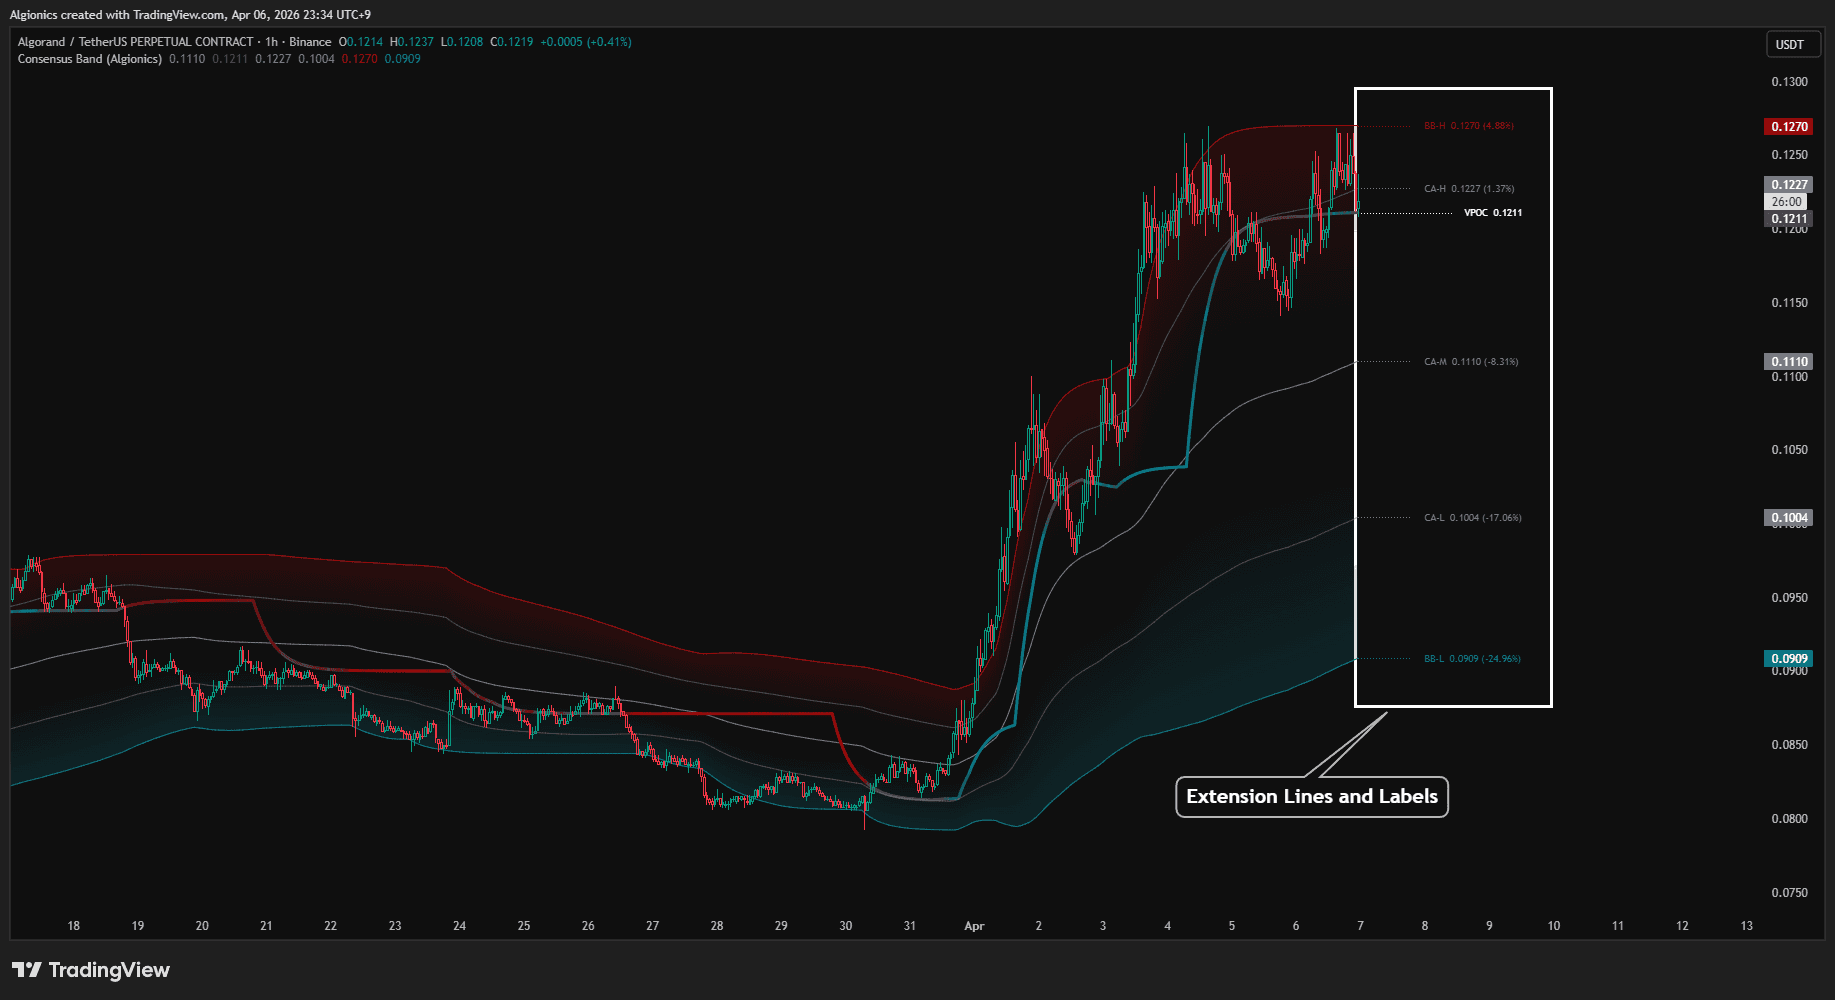
At the right edge of the chart, each active level extends with a dotted line and a label showing its name, price, and percentage distance from the VPOC.
When levels are close together, labels stagger automatically to avoid overlap.
Technical Identity
02
Spectral Volume Weighting
Most volume profiles weight every bar equally regardless of distance. Consensus Band does not.
A spectral weight curve is derived from a 28-line EMA ribbon spanning periods 20 to 236. Recent bars receive full weight. As distance increases, weight decays according to how many ribbon lines still include that bar in their lookback.
This produces a smooth, non-arbitrary rolloff that mirrors the multi-scale temporal structure of the ribbon itself.
Log-Space Profiling
The entire profile is built in logarithmic price space. Each row is spaced by equal ratios rather than equal dollar amounts.
A 5% move receives the same visual weight whether the price is 10 or 10,000. This eliminates the distortion that linear-scale profiles introduce on assets with wide price ranges.
σ-Derived Band Structure
Band levels are derived directly from the volume profile's statistical distribution. The volume-weighted mean and standard deviation of the profile determine every boundary.
The Consensus Area spans ±1σ from the mean. The Boundary Band spans ±2σ. No fixed width, no manual input. The data decides.
Parabolic Interpolation
The VPOC is not simply the row with the highest volume count. After finding the peak row, the algorithm applies parabolic interpolation across the peak and its two neighbors to compute a sub-row precise location.
This removes the staircase effect that row-based profiles typically produce, yielding a smooth VPOC that tracks the true volume peak.
Geometric Midpoint
CA-M is computed as √(CA-H × CA-L), the geometric mean of the Consensus Area boundaries. In log space, this places the midpoint at equal proportional distance from both edges.
An arithmetic mean would drift toward the higher boundary on assets with large percentage swings. The geometric mean does not.
Zero Configuration
Every parameter in the system derives from the data. The ribbon structure sets the lookback weights. The profile's own distribution sets the band widths. The smoothing length derives from the ribbon maximum as √236.
Nothing is hardcoded. The indicator adapts to whatever market and timeframe you give it.
Bar-Close Optimization
When enabled, the full volume profile rebuild runs only on confirmed bar closes and on the current last bar. Intermediate ticks within a forming bar are skipped.
This reduces computational load significantly without affecting the output on any completed bar.
Settings
03
Consensus Band Settings
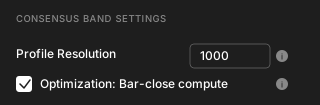
Profile Resolution controls how many price rows the volume profile uses. Higher values produce finer detail. The default is 1000. Lower values may help performance on older devices.
Bar-close compute limits heavy calculations to confirmed bar closes and the current last bar. This reduces load without affecting output on completed bars.
VPOC
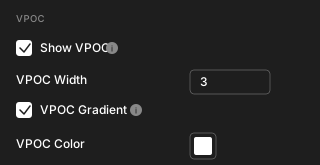
Show VPOC toggles the VPOC line and its extension label.
VPOC Width sets the thickness of the VPOC line.
VPOC Gradient shifts the line color based on where the current price sits within the band. When disabled, the line uses VPOC Color.
VPOC Color sets the fixed color used when VPOC Gradient is off.
Consensus Area
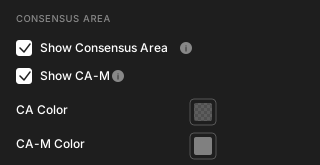
Show Consensus Area toggles the CA-H and CA-L lines and their extension labels.
Show CA-M toggles the geometric midpoint line between CA-H and CA-L.
CA Color sets the color for the CA-H and CA-L lines.
CA-M Color sets the color for the midpoint line.
Boundary Band
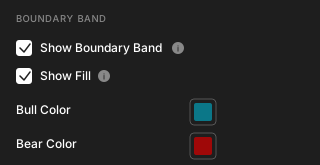
Show Boundary Band toggles the BB-H and BB-L lines and their extension labels.
Show Fill adds gradient shading between the Boundary Band and the Consensus Area. The upper zone shades in bear color, the lower zone in bull color.
Bull Color sets the color for BB-L and the lower fill zone.
Bear Color sets the color for BB-H and the upper fill zone.
Tips
05
Band Width as a Volatility Signal
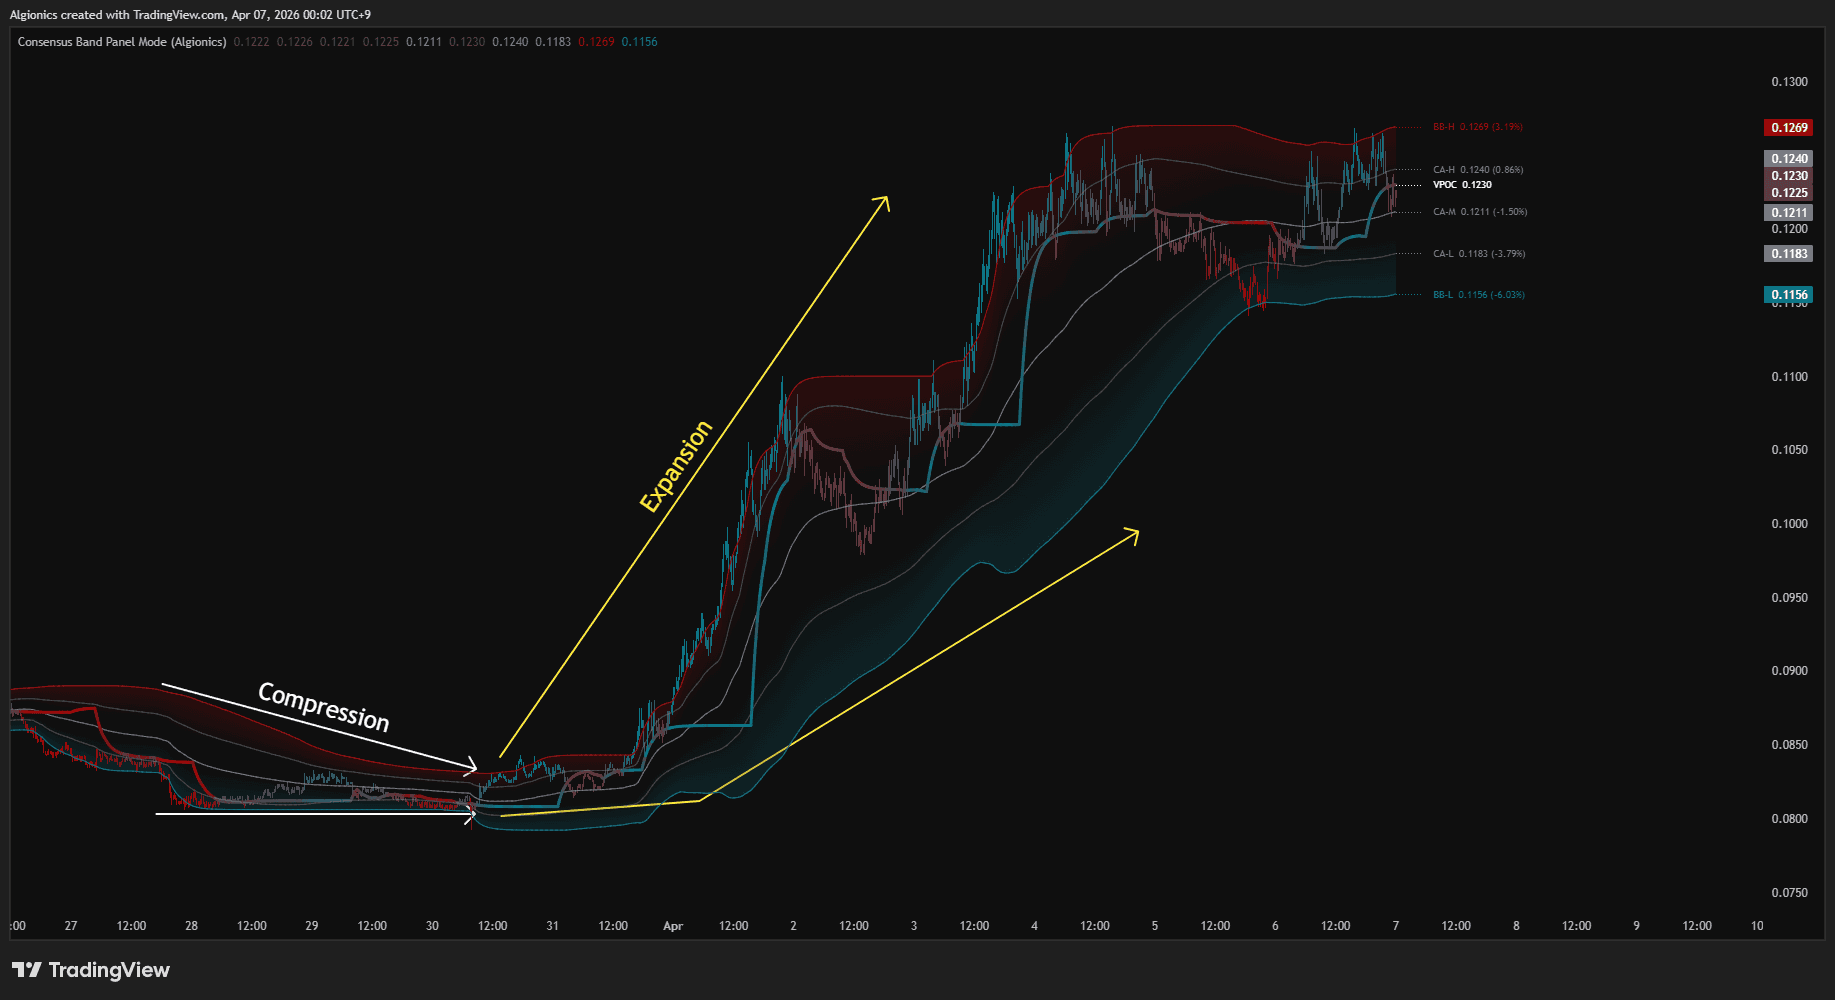
When the Consensus Area narrows, volume is concentrating into a tight range. This typically precedes expansion. When it widens, volume is spread across a broad range and the market is already in motion.
Running Both Modes
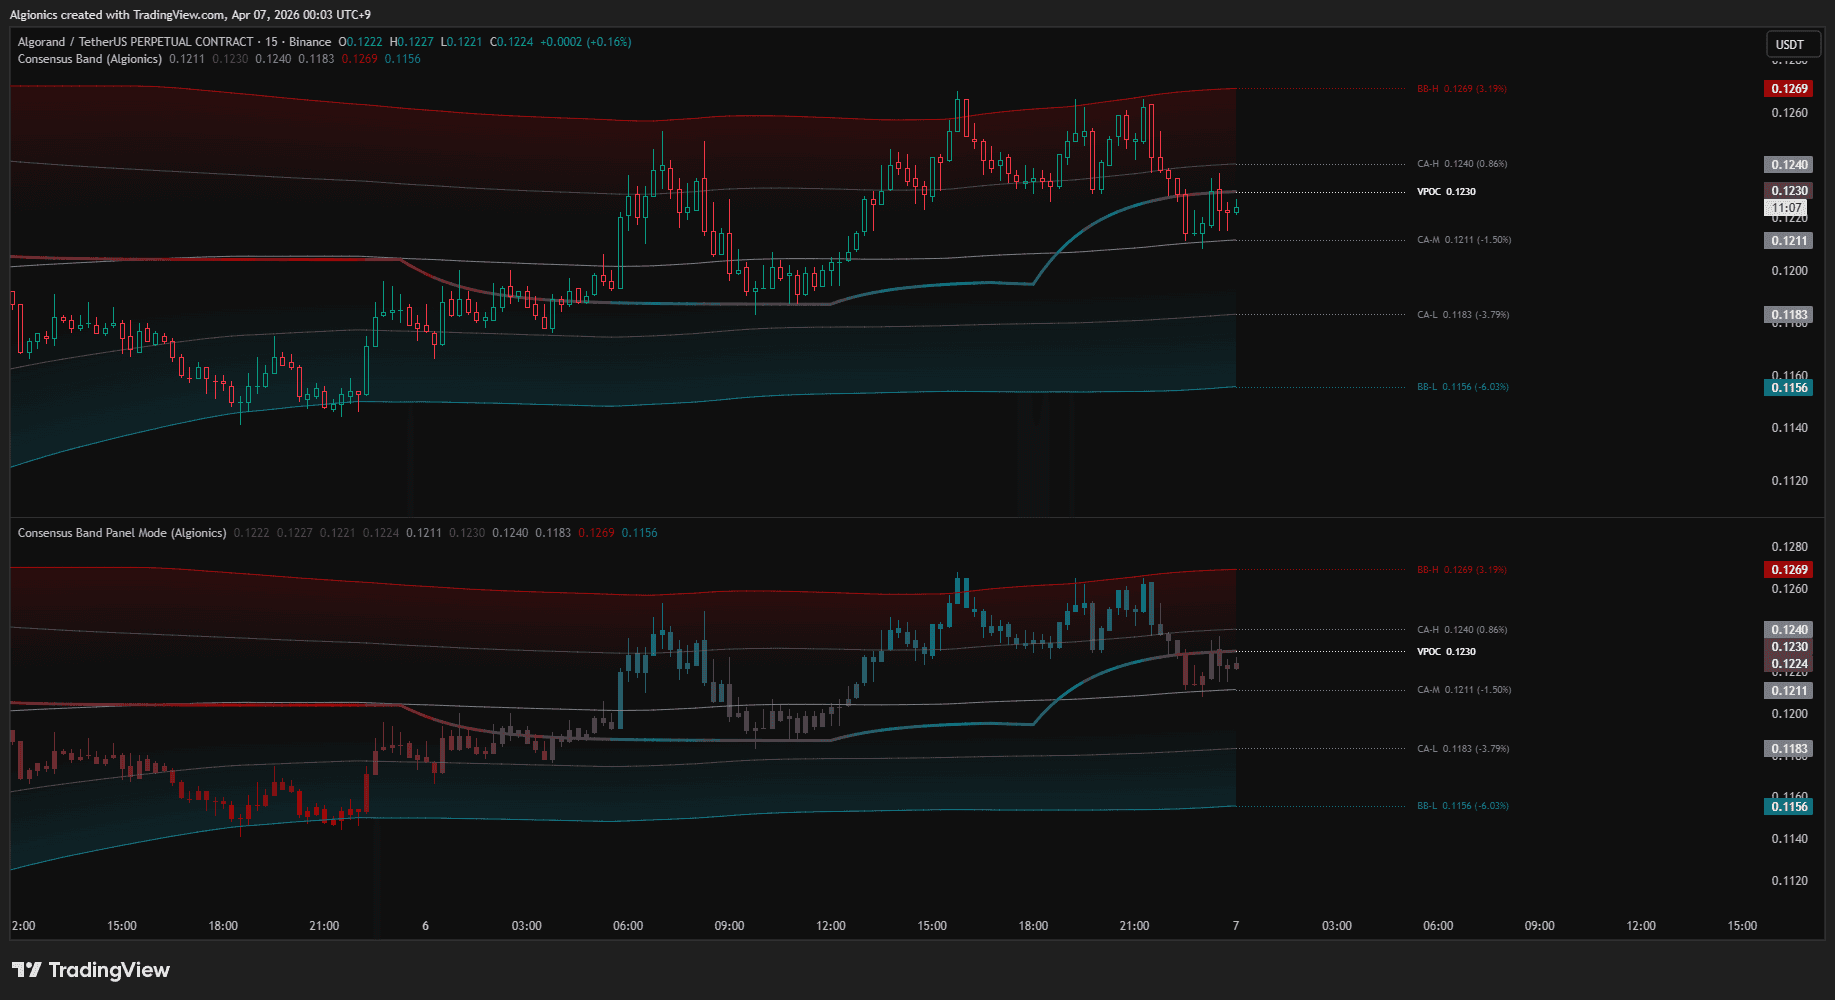
Adding both modes to the same chart is a display preference. The bands and levels are identical. Choose Overlay to keep your main chart clean with band lines, or Panel to read σ-Position candle colors in a separate view.
Level Crossovers
Watch for price crossing the band levels. A move from below to above the VPOC suggests a shift from bearish to bullish positioning within the volume structure. Crossing CA-H or CA-L marks a transition between the consensus zone and the extended zone. Crossing BB-H or BB-L means price has moved beyond ±2σ of the weighted distribution.
Reading the VPOC Gradient
When VPOC Gradient is on, the line itself becomes a position indicator. You do not need to check where price is relative to the bands. The color tells you. Teal means price is in the upper half, red means the lower half.